
 Yahoo Finance
 Calculating The Fair Value Of Toromont Industries Ltd. (TSE:TIH)
Key Insights
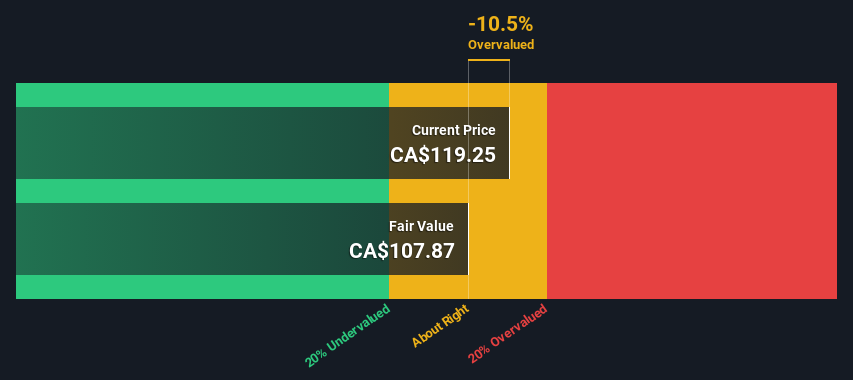
Toromont Industries' estimated fair value is CA$108 based on 2 Stage Free Cash Flow to Equity
With CA$119 share price, Toromont Industries appears to be trading close to its estimated fair value
Our fair value estimate is 21% lower than Toromont Industries' analyst price target of CA$136
How far off is Toromont Industries Ltd. (TSE:TIH) from its intrinsic value? Using the most recent financial data, we'll take a look at whether the stock is fairly priced by estimating the company's future cash flows and discounting them to their present value. One way to achieve this is by employing the Discounted Cash Flow (DCF) model. Models like these may appear beyond the comprehension of a lay person, but they're fairly easy to follow.
We would caution that there are many ways of valuing a company and, like the DCF, each technique has advantages and disadvantages in certain scenarios. For those who are keen learners of equity analysis, the Simply Wall St analysis model here may be something of interest to you.
See our latest analysis for Toromont Industries
Step By Step Through The Calculation
We use what is known as a 2-stage model, which simply means we have two different periods of growth rates for the company's cash flows. Generally the first stage is higher growth, and the second stage is a lower growth phase. To begin with, we have to get estimates of the next ten years of cash flows. Where possible we use analyst estimates, but when these aren't available we extrapolate the previous free cash flow (FCF) from the last estimate or reported value. We assume companies with shrinking free cash flow will slow their rate of shrinkage, and that companies with growing free cash flow will see their growth rate slow, over this period. We do this to reflect that growth tends to slow more in the early years than it does in later years.
A DCF is all about the idea that a dollar in the future is less valuable than a dollar today, so we discount the value of these future cash flows to their estimated value in today's dollars:
10-year free cash flow (FCF) forecast
2024 | 2025 | 2026 | 2027 | 2028 | 2029 | 2030 | 2031 | 2032 | 2033 | |
Levered FCF (CA$, Millions) | CA$358.5m | CA$439.3m | CA$463.4m | CA$469.4m | CA$476.5m | CA$484.6m | CA$493.3m | CA$502.7m | CA$512.5m | CA$522.6m |
Growth Rate Estimate Source | Analyst x3 | Analyst x3 | Analyst x1 | Est @ 1.29% | Est @ 1.53% | Est @ 1.69% | Est @ 1.81% | Est @ 1.89% | Est @ 1.95% | Est @ 1.99% |
Present Value (CA$, Millions) Discounted @ 7.0% | CA$335 | CA$384 | CA$379 | CA$359 | CA$340 | CA$324 | CA$308 | CA$293 | CA$280 | CA$267 |
("Est" = FCF growth rate estimated by Simply Wall St)
Present Value of 10-year Cash Flow (PVCF) = CA$3.3b
We now need to calculate the Terminal Value, which accounts for all the future cash flows after this ten year period. The Gordon Growth formula is used to calculate Terminal Value at a future annual growth rate equal to the 5-year average of the 10-year government bond yield of 2.1%. We discount the terminal cash flows to today's value at a cost of equity of 7.0%.
Terminal Value (TV)= FCF2033 × (1 + g) ÷ (r – g) = CA$523m× (1 + 2.1%) ÷ (7.0%– 2.1%) = CA$11b
Present Value of Terminal Value (PVTV)= TV / (1 + r)10= CA$11b÷ ( 1 + 7.0%)10= CA$5.6b
The total value is the sum of cash flows for the next ten years plus the discounted terminal value, which results in the Total Equity Value, which in this case is CA$8.8b. To get the intrinsic value per share, we divide this by the total number of shares outstanding. Compared to the current share price of CA$119, the company appears around fair value at the time of writing. Valuations are imprecise instruments though, rather like a telescope - move a few degrees and end up in a different galaxy. Do keep this in mind.
The Assumptions
We would point out that the most important inputs to a discounted cash flow are the discount rate and of course the actual cash flows. Part of investing is coming up with your own evaluation of a company's future performance, so try the calculation yourself and check your own assumptions. The DCF also does not consider the possible cyclicality of an industry, or a company's future capital requirements, so it does not give a full picture of a company's potential performance. Given that we are looking at Toromont Industries as potential shareholders, the cost of equity is used as the discount rate, rather than the cost of capital (or weighted average cost of capital, WACC) which accounts for debt. In this calculation we've used 7.0%, which is based on a levered beta of 1.061. Beta is a measure of a stock's volatility, compared to the market as a whole. We get our beta from the industry average beta of globally comparable companies, with an imposed limit between 0.8 and 2.0, which is a reasonable range for a stable business.
SWOT Analysis for Toromont Industries
Strength
Earnings growth over the past year exceeded the industry.
Debt is not viewed as a risk.
Dividends are covered by earnings and cash flows.
Weakness
Earnings growth over the past year is below its 5-year average.
Dividend is low compared to the top 25% of dividend payers in the Trade Distributors market.
Expensive based on P/E ratio and estimated fair value.
Opportunity
Annual earnings are forecast to grow for the next 2 years.
Threat
Annual earnings are forecast to grow slower than the Canadian market.
Next Steps:
Whilst important, the DCF calculation ideally won't be the sole piece of analysis you scrutinize for a company. It's not possible to obtain a foolproof valuation with a DCF model. Instead the best use for a DCF model is to test certain assumptions and theories to see if they would lead to the company being undervalued or overvalued. For example, changes in the company's cost of equity or the risk free rate can significantly impact the valuation. For Toromont Industries, we've put together three relevant factors you should further research:
Financial Health: Does TIH have a healthy balance sheet? Take a look at our free balance sheet analysis with six simple checks on key factors like leverage and risk.
Future Earnings: How does TIH's growth rate compare to its peers and the wider market? Dig deeper into the analyst consensus number for the upcoming years by interacting with our free analyst growth expectation chart.
Other High Quality Alternatives: Do you like a good all-rounder? Explore our interactive list of high quality stocks to get an idea of what else is out there you may be missing!
PS. Simply Wall St updates its DCF calculation for every Canadian stock every day, so if you want to find the intrinsic value of any other stock just search here.
Have feedback on this article? Concerned about the content? Get in touch with us directly. Alternatively, email editorial-team (at) simplywallst.com.
This article by Simply Wall St is general in nature. We provide commentary based on historical data and analyst forecasts only using an unbiased methodology and our articles are not intended to be financial advice. It does not constitute a recommendation to buy or sell any stock, and does not take account of your objectives, or your financial situation. We aim to bring you long-term focused analysis driven by fundamental data. Note that our analysis may not factor in the latest price-sensitive company announcements or qualitative material. Simply Wall St has no position in any stocks mentioned.
Have feedback on this article? Concerned about the content? Get in touch with us directly. Alternatively, email editorial-team@simplywallst.com
