
 Yahoo Finance
 Brisbane Broncos (ASX:BBL) shareholders have earned a 19% CAGR over the last five years
While Brisbane Broncos Limited (ASX:BBL) shareholders are probably generally happy, the stock hasn't had particularly good run recently, with the share price falling 13% in the last quarter. But that doesn't change the fact that the returns over the last five years have been very strong. Indeed, the share price is up an impressive 123% in that time. Generally speaking the long term returns will give you a better idea of business quality than short periods can. Only time will tell if there is still too much optimism currently reflected in the share price.
So let's investigate and see if the longer term performance of the company has been in line with the underlying business' progress.
View our latest analysis for Brisbane Broncos
While the efficient markets hypothesis continues to be taught by some, it has been proven that markets are over-reactive dynamic systems, and investors are not always rational. By comparing earnings per share (EPS) and share price changes over time, we can get a feel for how investor attitudes to a company have morphed over time.
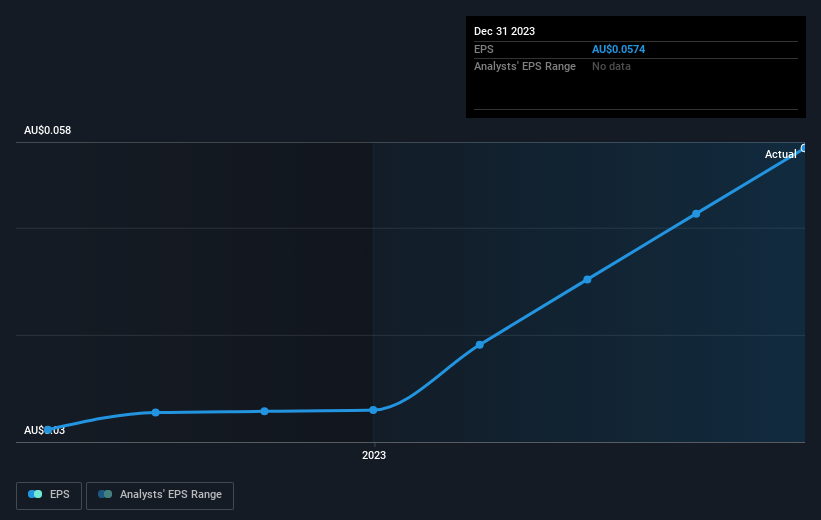
During the last half decade, Brisbane Broncos became profitable. That kind of transition can be an inflection point that justifies a strong share price gain, just as we have seen here.
You can see below how EPS has changed over time (discover the exact values by clicking on the image).
It might be well worthwhile taking a look at our free report on Brisbane Broncos' earnings, revenue and cash flow.
What About Dividends?
It is important to consider the total shareholder return, as well as the share price return, for any given stock. The TSR is a return calculation that accounts for the value of cash dividends (assuming that any dividend received was reinvested) and the calculated value of any discounted capital raisings and spin-offs. Arguably, the TSR gives a more comprehensive picture of the return generated by a stock. As it happens, Brisbane Broncos' TSR for the last 5 years was 142%, which exceeds the share price return mentioned earlier. This is largely a result of its dividend payments!
A Different Perspective
Brisbane Broncos shareholders are down 5.4% for the year (even including dividends), but the market itself is up 14%. However, keep in mind that even the best stocks will sometimes underperform the market over a twelve month period. Longer term investors wouldn't be so upset, since they would have made 19%, each year, over five years. If the fundamental data continues to indicate long term sustainable growth, the current sell-off could be an opportunity worth considering. I find it very interesting to look at share price over the long term as a proxy for business performance. But to truly gain insight, we need to consider other information, too. Even so, be aware that Brisbane Broncos is showing 1 warning sign in our investment analysis , you should know about...
Of course Brisbane Broncos may not be the best stock to buy. So you may wish to see this free collection of growth stocks.
Please note, the market returns quoted in this article reflect the market weighted average returns of stocks that currently trade on Australian exchanges.
Have feedback on this article? Concerned about the content? Get in touch with us directly. Alternatively, email editorial-team (at) simplywallst.com.
This article by Simply Wall St is general in nature. We provide commentary based on historical data and analyst forecasts only using an unbiased methodology and our articles are not intended to be financial advice. It does not constitute a recommendation to buy or sell any stock, and does not take account of your objectives, or your financial situation. We aim to bring you long-term focused analysis driven by fundamental data. Note that our analysis may not factor in the latest price-sensitive company announcements or qualitative material. Simply Wall St has no position in any stocks mentioned.
