
 Yahoo Finance
 Brinker International's (NYSE:EAT) earnings growth rate lags the 71% return delivered to shareholders
If you want to compound wealth in the stock market, you can do so by buying an index fund. But if you pick the right individual stocks, you could make more than that. To wit, the Brinker International, Inc. (NYSE:EAT) share price is 71% higher than it was a year ago, much better than the market return of around 23% (not including dividends) in the same period. If it can keep that out-performance up over the long term, investors will do very well! The longer term returns have not been as good, with the stock price only 7.4% higher than it was three years ago.
While this past week has detracted from the company's one-year return, let's look at the recent trends of the underlying business and see if the gains have been in alignment.
Check out our latest analysis for Brinker International
To paraphrase Benjamin Graham: Over the short term the market is a voting machine, but over the long term it's a weighing machine. One way to examine how market sentiment has changed over time is to look at the interaction between a company's share price and its earnings per share (EPS).
Brinker International was able to grow EPS by 70% in the last twelve months. This EPS growth is remarkably close to the 71% increase in the share price. That suggests that the market sentiment around the company hasn't changed much over that time. We don't think its coincidental that the share price is growing at a similar rate to the earnings per share.
The company's earnings per share (over time) is depicted in the image below (click to see the exact numbers).
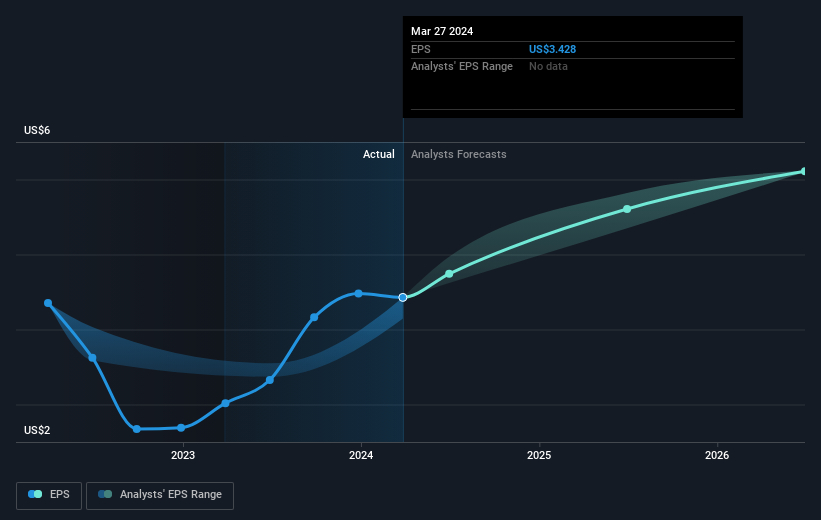
It is of course excellent to see how Brinker International has grown profits over the years, but the future is more important for shareholders. If you are thinking of buying or selling Brinker International stock, you should check out this FREE detailed report on its balance sheet.
A Different Perspective
We're pleased to report that Brinker International shareholders have received a total shareholder return of 71% over one year. That gain is better than the annual TSR over five years, which is 11%. Therefore it seems like sentiment around the company has been positive lately. Someone with an optimistic perspective could view the recent improvement in TSR as indicating that the business itself is getting better with time. I find it very interesting to look at share price over the long term as a proxy for business performance. But to truly gain insight, we need to consider other information, too. For example, we've discovered 2 warning signs for Brinker International that you should be aware of before investing here.
If you would prefer to check out another company -- one with potentially superior financials -- then do not miss this free list of companies that have proven they can grow earnings.
Please note, the market returns quoted in this article reflect the market weighted average returns of stocks that currently trade on American exchanges.
Have feedback on this article? Concerned about the content? Get in touch with us directly. Alternatively, email editorial-team (at) simplywallst.com.
This article by Simply Wall St is general in nature. We provide commentary based on historical data and analyst forecasts only using an unbiased methodology and our articles are not intended to be financial advice. It does not constitute a recommendation to buy or sell any stock, and does not take account of your objectives, or your financial situation. We aim to bring you long-term focused analysis driven by fundamental data. Note that our analysis may not factor in the latest price-sensitive company announcements or qualitative material. Simply Wall St has no position in any stocks mentioned.
Have feedback on this article? Concerned about the content? Get in touch with us directly. Alternatively, email editorial-team@simplywallst.com
