
 Yahoo Finance
 BlackRock Inc's Dividend Analysis
An In-Depth Look at BlackRock Inc's Upcoming Dividend and Its Historical Performance
BlackRock Inc (NYSE:BLK) recently announced a dividend of $5.1 per share, payable on June 24, 2024, with the ex-dividend date set for June 7, 2024. As investors anticipate this upcoming payment, it is crucial to examine the company's dividend history, yield, and growth rates. Utilizing data from GuruFocus, this analysis delves into BlackRock Inc's dividend performance and evaluates its sustainability.
What Does BlackRock Inc Do?
This Powerful Chart Made Peter Lynch 29% A Year For 13 Years
How to calculate the intrinsic value of a stock?
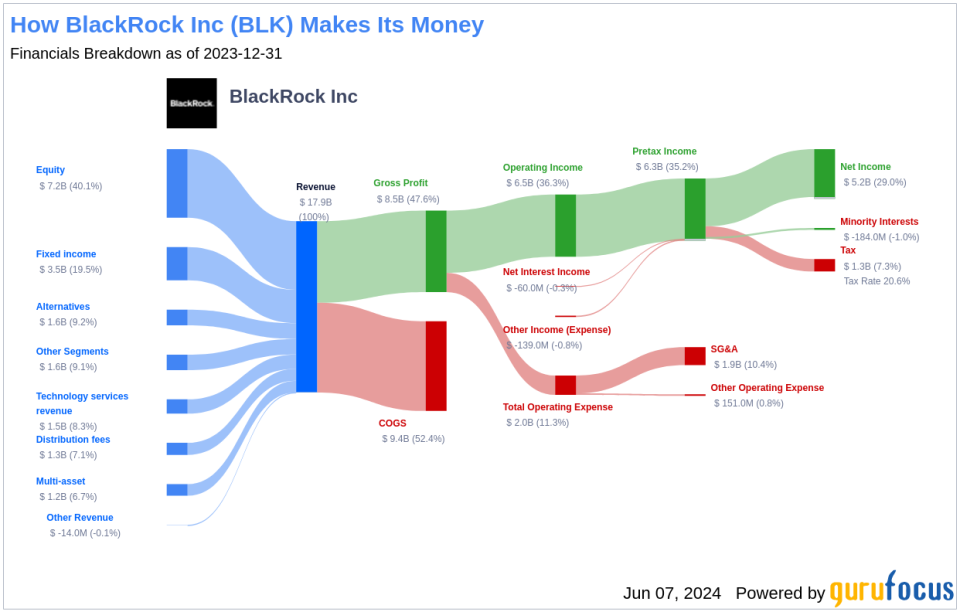
BlackRock Inc is the world's largest asset manager, boasting $10.473 trillion in assets under management as of March 2024. The company offers a diverse product mix, with 54% of managed assets in equity strategies, 27% in fixed income, 9% in multi-asset classes, 7% in money market funds, and 3% in alternatives. About two-thirds of its long-term AUM are in passive strategies, with its ETF platform holding a significant market share both domestically and globally. BlackRock serves institutional clients primarily, which represent about 80% of AUM, and operates with a broad geographic reach, serving clients in over 100 countries with more than one-third of managed assets from outside the US and Canada.
A Glimpse at BlackRock Inc's Dividend History
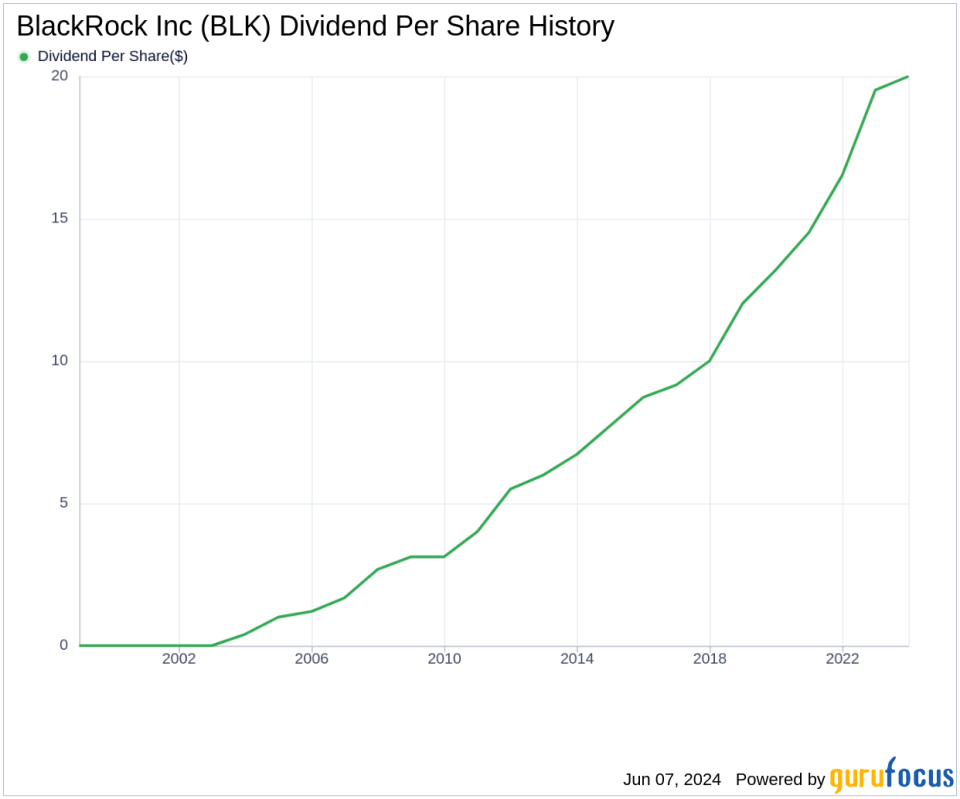
Since 2003, BlackRock Inc has consistently paid dividends, distributing them on a quarterly basis. The company has increased its dividend annually since then, earning it the status of a dividend achiever. This accolade is reserved for companies that have raised their dividends for at least the past 21 years.
Below is a chart illustrating the annual Dividends Per Share to track historical trends.
Breaking Down BlackRock Inc's Dividend Yield and Growth
Currently, BlackRock Inc boasts a 12-month trailing dividend yield of 2.57% and a forward dividend yield of 2.61%, indicating an expected increase in dividend payments over the next year. Over the past three years, the company's annual dividend growth rate was 11.30%, extending to 11.60% over five years, and reaching 11.80% over the past decade. As of today, the 5-year yield on cost for BlackRock Inc stock is approximately 4.45%.

The Sustainability Question: Payout Ratio and Profitability
The dividend payout ratio, standing at 0.51 as of March 31, 2024, offers insights into the portion of earnings BlackRock Inc distributes as dividends. This lower ratio suggests the company retains a significant portion of its earnings, which supports future growth and provides a buffer against downturns. BlackRock Inc's profitability rank is 9 out of 10, indicating strong profitability relative to peers, further evidenced by consistent positive net income over the past decade.
Growth Metrics: The Future Outlook
BlackRock Inc's growth rank of 9 out of 10 indicates a strong growth trajectory. The company's revenue per share and 3-year revenue growth rate of 4.20% per year, although below some global competitors, still demonstrates a robust revenue model. Its 3-year EPS growth rate and 5-year EBITDA growth rate of 7.40% further underline its capacity for sustained earnings, crucial for maintaining dividends.
Concluding Thoughts on BlackRock Inc's Dividend Sustainability
Considering BlackRock Inc's consistent dividend increases, a manageable payout ratio, and strong profitability, the outlook for its dividend sustainability is positive. The company's robust growth metrics further support this view, suggesting that BlackRock Inc is well-positioned to continue rewarding its shareholders with stable and growing dividends. Investors seeking high-dividend yield opportunities may find BlackRock Inc an attractive option, and can explore more such stocks using the High Dividend Yield Screener available to GuruFocus Premium users.
This article, generated by GuruFocus, is designed to provide general insights and is not tailored financial advice. Our commentary is rooted in historical data and analyst projections, utilizing an impartial methodology, and is not intended to serve as specific investment guidance. It does not formulate a recommendation to purchase or divest any stock and does not consider individual investment objectives or financial circumstances. Our objective is to deliver long-term, fundamental data-driven analysis. Be aware that our analysis might not incorporate the most recent, price-sensitive company announcements or qualitative information. GuruFocus holds no position in the stocks mentioned herein.
This article first appeared on GuruFocus.
