
 Yahoo Finance
 Bitcoin's Short Term Momentum Flips Bearish; Support Under $65K
Technical indicators suggest that bitcoin’s short-term momentum has flipped bearish.
The 50-day simple moving average marks major support at $64,870.
Technical indicators that gauge bitcoin's {{BTC}} price movement over the short term have flipped bearish, with crucial support positioned under $65,000.
The cryptocurrency’s 10-day momentum, which compares the going market price with the price from 10 days ago, has declined below zero, indicating renewed negative momentum. Traders use the momentum indicator to confirm market trends and spot trend exhaustion.
Similarly, the moving average convergence divergence (MACD) histogram, which employs the 26-day and 12-day exponential moving averages, has turned negative. The indicator is widely used to spot trend changes, with crossovers under zero signaling price losses.
Both indicators suggest the path of least resistance is to the downside, which is consistent with analysts’ view that rising U.S. Treasury yields pose a downside risk to bitcoin.
The pivotal 50-day simple moving average at $64,870 is the key support to watch out for. The probability of a drop toward the same would increase should the U.S. inflation data, due later Friday, beat estimates.
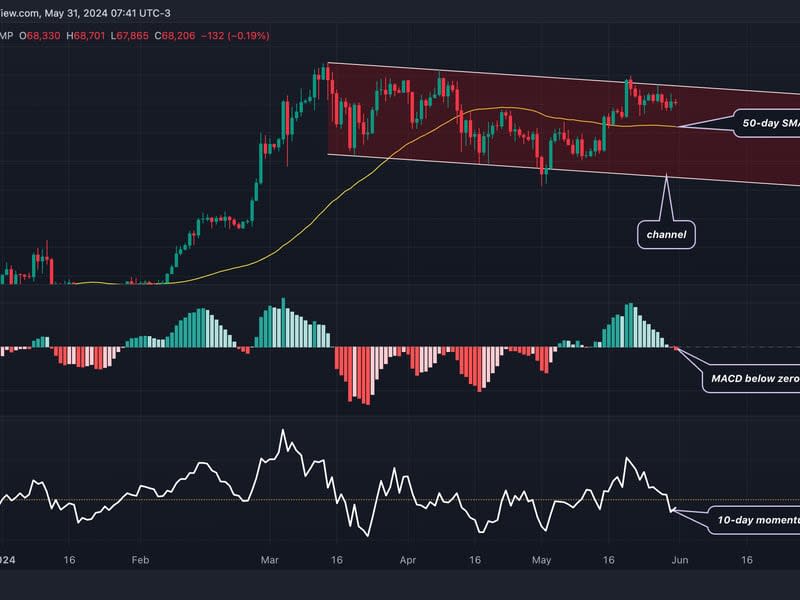
The upper end of the channel, identified by trendlines connecting highs and lows hit in March and April, is the resistance for the bulls to beat. A move higher would mean the resumption of the broader uptrend.
