
 Yahoo Finance
 Better Buy: CapitaLand Integrated Commercial Trust Versus Keppel DC REIT
The earnings season is winding down, giving investors more time to review the results and business updates of the stocks they are eyeing.
We are doing the same with a focus on the REIT sector which has been buffeted by the twin headwinds of high inflation and surging interest rates.
Investors may be interested in retail and commercial REIT CapitaLand Integrated Commercial Trust (SGX: C38U), or CICT, which recently released a robust set of earnings.
Likewise, many income investors also have their eye on data centre REIT Keppel DC REIT (SGX: AJBU).
We compare these two REITs side by side to see which makes the more compelling investment choice.
Portfolio composition

First, let us look at each REIT’s portfolio.
Both REITs have more than 20 properties within their portfolios, though the nature of these properties is different.
CICT’s portfolio comprises retail and heartland malls along with commercial buildings.
Keppel DC REIT’s portfolio, on the other hand, consists of data centres.
CICT’s portfolio is present in just three countries – Singapore, Australia, and Germany, while Keppel DC REIT’s data centres are spread across nine countries.
CICT’s assets under management are nearly seven times that of Keppel DC REIT, giving it more clout when it comes to negotiating deals and acquisitions.
Winner: CICT
Financials and portfolio valuation
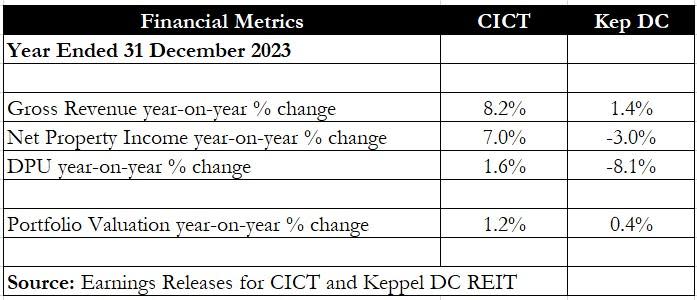
Next, we look at each REIT’s latest 2023 financials and their distribution per unit (DPU).
Keppel DC REIT reported a mixed set of results with revenue rising 1.4% year on year but net property income (NPI) slipping by 3% year on year.
Because of a loss allowance made for its Guangdong data centres, the REIT’s DPU tumbled by 8.1% year on year to S$0.09383.
CICT, on the other hand, posted a strong financial performance with both gross revenue and NPI rising year on year.
The retail and commercial REIT also saw its DPU increase by 1.6% year on year to S$0.1075.
The end of the fiscal year will typically see REITs reporting on their portfolio valuations.
A higher or stable valuation in an environment of increasing interest rates implies that the REIT’s properties see strong demand and can hold their value.
Both CICT and Keppel DC REIT enjoyed year-on-year valuation increases which is a positive sign for the two REITs.
Winner: CICT
Debt metrics

Moving on to debt metrics next.
Both REITs have a gearing ratio under 40%, thus allowing them to gear up further for yield-accretive acquisitions.
However, Keppel DC REIT has a higher interest cover ratio of 4.7 times with a slightly lower cost of debt of 3.3% (versus 3.4% for CICT).
For fixed-rate borrowings, both REITs have this at the 70%-level which helps to mitigate the impact of rising interest rates.
Keppel DC REIT is less sensitive to interest rate increases compared with CICT as a 1% rise in rates will only lower its DPU by 2.6% versus 3% for CICT.
Winner: Keppel DC REIT
Operating metrics

The next few attributes to look at are each REIT’s occupancy rate, weighted average lease expiry (WALE) and rental reversion.
These are all referred to as operating metrics.
Keppel DC REIT has a slightly higher occupancy rate than CICT but both REITs sport very healthy occupancies above 95%.
The data centre REIT also has a much longer WALE compared to CICT.
No information was available, though, for rental reversion for Keppel DC REIT.
CICT saw positive rental reversions for both its retail and commercial components.
Winner: Keppel DC REIT
Distribution yield

Finally, we look at the most important metric for income investors – each REIT’s distribution yield.
Alas, both REITs are sporting the same distribution yield of 5.5%.
Although no REIT has the upper hand for this metric, investors should note that this is a very attractive yield compared with the CPF Ordinary Account interest rate of 2.5%.
Winner: It’s a draw!
Get Smart: A tough decision
It is tough to decide between these two REITs.
Each has its own merits and distribution yield cannot be used to justify one over the other.
Keppel DC REIT has, however, disclosed that it has a pipeline of more than S$2 billion of data centres that can be injected into it from its sponsor Keppel Ltd (SGX: BN4).
CICT also has the backing of its sponsor CapitaLand Investment Limited (SGX: 9CI) which periodically divests its slate of properties into its listed REITs to recycle capital into funds under management.
Investors can decide which REIT they prefer based on the attributes above.
You can also choose to own both if you cannot decide as to which is superior.
In our latest report, we dive into five standout Singapore REITs offering distribution yields exceeding 5.5%. Why settle for less? Get more dividends hitting your bank account with our REITs guide. Click here to download for free now.
Follow us on Facebook and Telegram for the latest investing news and analyses!
Disclosure: Royston Yang owns shares of Keppel DC REIT.
The post Better Buy: CapitaLand Integrated Commercial Trust Versus Keppel DC REIT appeared first on The Smart Investor.
