
 Yahoo Finance
 Bank of America data shows today marks beginning of the S&P 500’s ‘strongest’ average 10-day period of the year…over 96 years
The first week of July since 1928 has secretly marked the most successful two-week period for investors in the S&P 500 index (SPX), tracking the movement of the largest companies listed on American stock exchanges, according to research published today by Bank of America’s chief equity strategist, Stephen Suttmeier.
The S&P 500 is up 0.17% today, and 22.76% year over year, reaching an all-time high of 5,487 on June 18.
Of course, past performance is no guarantee of future success, but that’s a 96-years-long trend, going back to before the Great Depression. Given that this is a U.S. presidential election year, those gains could last even longer, according to the same report—assuming the past trend continues, of course.
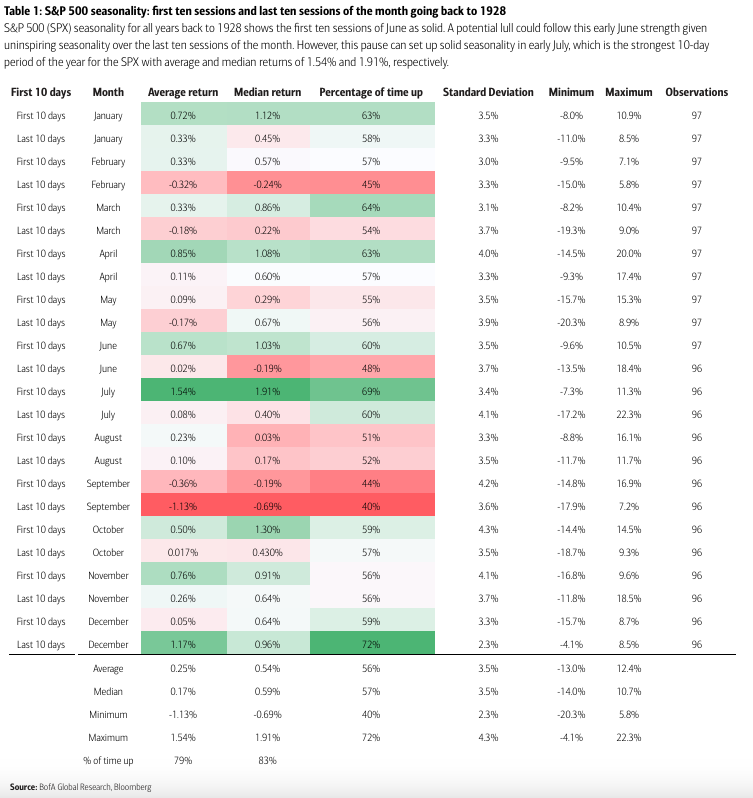
“The first 10 sessions of July are the strongest of the year with the SPX up 69% of the time on an average return of 1.54% (1.91% median),” according to the report. That means while not every year was a winner during this period, it was up 69% of the time.
The next highest return based on annual averages going back to 1928 are the last 10 sessions of December, when there’s a 1.17% average return and a 0.96% median return. Trades are up about 72% of the time. The average returns of all sessions throughout the year is 0.25%, according to the report, with an average of all the medians being 0.54%.
The peak of average returns can happen a bit earlier in presidential election years, with average returns of 1.59% as early as June, before falling off for the end of the month and finishing strong starting in July and persisting throughout the summer.
“The last 10 sessions of June could provide a pause,” according to the report. “But the early July into early August periods have solid 10-day seasonality in presidential election years.”
While the election cycle may impact returns over the two-week periods, Shawn Snyder, executive director and global investment strategist at J.P. Morgan, this May said there’s little evidence to support the “frequent belief” that if a particular candidate wins, “the stock market is going to crash." A Morgan Stanley report shows stock markets generate a total average return of 11.28% in election years, with 15.3% in years when a Republican was elected and 7.6% in years when a Democrat was elected.
The Bank of America findings come from Suttmeier’s widely read Monthly Chart Portfolio of Global Markets. Suttmeier has worked at Merrill Lynch for 17 years and joined Bank of America in 2008 when it bought the wealth management company.
This story was originally featured on Fortune.com
