
 Yahoo Finance
 Avnet (NASDAQ:AVT) stock performs better than its underlying earnings growth over last five years
When you buy and hold a stock for the long term, you definitely want it to provide a positive return. But more than that, you probably want to see it rise more than the market average. Unfortunately for shareholders, while the Avnet, Inc. (NASDAQ:AVT) share price is up 35% in the last five years, that's less than the market return. However, more recent buyers should be happy with the increase of 21% over the last year.
After a strong gain in the past week, it's worth seeing if longer term returns have been driven by improving fundamentals.
View our latest analysis for Avnet
To quote Buffett, 'Ships will sail around the world but the Flat Earth Society will flourish. There will continue to be wide discrepancies between price and value in the marketplace...' One way to examine how market sentiment has changed over time is to look at the interaction between a company's share price and its earnings per share (EPS).
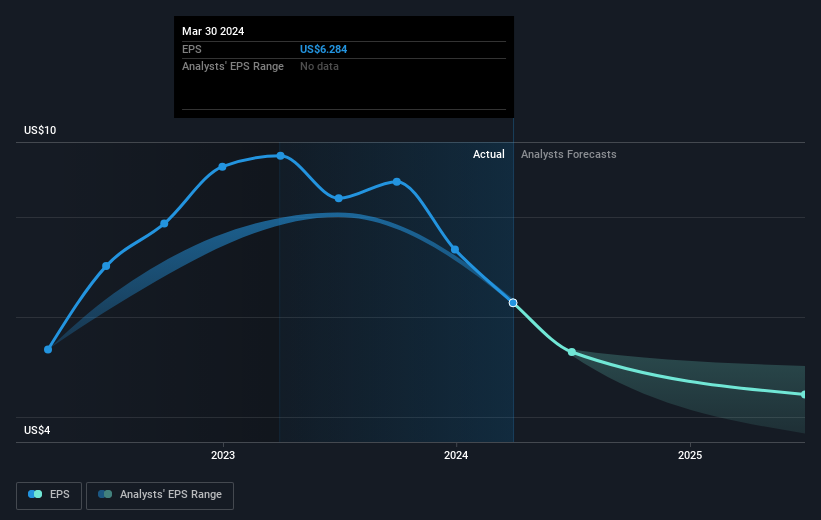
Over half a decade, Avnet managed to grow its earnings per share at 21% a year. The EPS growth is more impressive than the yearly share price gain of 6% over the same period. Therefore, it seems the market has become relatively pessimistic about the company. The reasonably low P/E ratio of 8.69 also suggests market apprehension.
You can see how EPS has changed over time in the image below (click on the chart to see the exact values).
We know that Avnet has improved its bottom line over the last three years, but what does the future have in store? You can see how its balance sheet has strengthened (or weakened) over time in this free interactive graphic.
What About Dividends?
When looking at investment returns, it is important to consider the difference between total shareholder return (TSR) and share price return. The TSR is a return calculation that accounts for the value of cash dividends (assuming that any dividend received was reinvested) and the calculated value of any discounted capital raisings and spin-offs. So for companies that pay a generous dividend, the TSR is often a lot higher than the share price return. As it happens, Avnet's TSR for the last 5 years was 52%, which exceeds the share price return mentioned earlier. This is largely a result of its dividend payments!
A Different Perspective
Avnet shareholders are up 24% for the year (even including dividends). But that return falls short of the market. On the bright side, that's still a gain, and it's actually better than the average return of 9% over half a decade This suggests the company might be improving over time. I find it very interesting to look at share price over the long term as a proxy for business performance. But to truly gain insight, we need to consider other information, too. Case in point: We've spotted 3 warning signs for Avnet you should be aware of, and 1 of them is significant.
If you like to buy stocks alongside management, then you might just love this free list of companies. (Hint: many of them are unnoticed AND have attractive valuation).
Please note, the market returns quoted in this article reflect the market weighted average returns of stocks that currently trade on American exchanges.
Have feedback on this article? Concerned about the content? Get in touch with us directly. Alternatively, email editorial-team (at) simplywallst.com.
This article by Simply Wall St is general in nature. We provide commentary based on historical data and analyst forecasts only using an unbiased methodology and our articles are not intended to be financial advice. It does not constitute a recommendation to buy or sell any stock, and does not take account of your objectives, or your financial situation. We aim to bring you long-term focused analysis driven by fundamental data. Note that our analysis may not factor in the latest price-sensitive company announcements or qualitative material. Simply Wall St has no position in any stocks mentioned.
