
 Yahoo Finance
 Avemio (ETR:3D6) Shareholders Will Want The ROCE Trajectory To Continue
What trends should we look for it we want to identify stocks that can multiply in value over the long term? In a perfect world, we'd like to see a company investing more capital into its business and ideally the returns earned from that capital are also increasing. Basically this means that a company has profitable initiatives that it can continue to reinvest in, which is a trait of a compounding machine. So when we looked at Avemio (ETR:3D6) and its trend of ROCE, we really liked what we saw.
Understanding Return On Capital Employed (ROCE)
If you haven't worked with ROCE before, it measures the 'return' (pre-tax profit) a company generates from capital employed in its business. Analysts use this formula to calculate it for Avemio:
Return on Capital Employed = Earnings Before Interest and Tax (EBIT) ÷ (Total Assets - Current Liabilities)
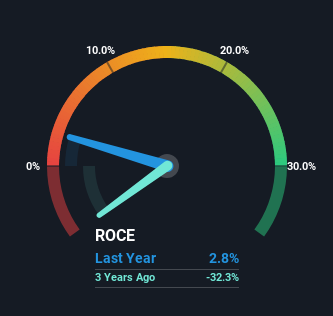
0.028 = €638k ÷ (€35m - €12m) (Based on the trailing twelve months to June 2023).
So, Avemio has an ROCE of 2.8%. Ultimately, that's a low return and it under-performs the Professional Services industry average of 6.5%.
See our latest analysis for Avemio
Above you can see how the current ROCE for Avemio compares to its prior returns on capital, but there's only so much you can tell from the past. If you'd like, you can check out the forecasts from the analysts covering Avemio for free.
The Trend Of ROCE
Avemio has recently broken into profitability so their prior investments seem to be paying off. Shareholders would no doubt be pleased with this because the business was loss-making four years ago but is is now generating 2.8% on its capital. Not only that, but the company is utilizing 8,580% more capital than before, but that's to be expected from a company trying to break into profitability. This can tell us that the company has plenty of reinvestment opportunities that are able to generate higher returns.
On a side note, we noticed that the improvement in ROCE appears to be partly fueled by an increase in current liabilities. The current liabilities has increased to 34% of total assets, so the business is now more funded by the likes of its suppliers or short-term creditors. Keep an eye out for future increases because when the ratio of current liabilities to total assets gets particularly high, this can introduce some new risks for the business.
The Key Takeaway
Long story short, we're delighted to see that Avemio's reinvestment activities have paid off and the company is now profitable. Although the company may be facing some issues elsewhere since the stock has plunged 88% in the last year. Regardless, we think the underlying fundamentals warrant this stock for further investigation.
One final note, you should learn about the 3 warning signs we've spotted with Avemio (including 1 which is concerning) .
If you want to search for solid companies with great earnings, check out this free list of companies with good balance sheets and impressive returns on equity.
Have feedback on this article? Concerned about the content? Get in touch with us directly. Alternatively, email editorial-team (at) simplywallst.com.
This article by Simply Wall St is general in nature. We provide commentary based on historical data and analyst forecasts only using an unbiased methodology and our articles are not intended to be financial advice. It does not constitute a recommendation to buy or sell any stock, and does not take account of your objectives, or your financial situation. We aim to bring you long-term focused analysis driven by fundamental data. Note that our analysis may not factor in the latest price-sensitive company announcements or qualitative material. Simply Wall St has no position in any stocks mentioned.
