
 Yahoo Finance
 Astro Malaysia Holdings Berhad (KLSE:ASTRO) investors are sitting on a loss of 72% if they invested five years ago
Long term investing is the way to go, but that doesn't mean you should hold every stock forever. It hits us in the gut when we see fellow investors suffer a loss. Anyone who held Astro Malaysia Holdings Berhad (KLSE:ASTRO) for five years would be nursing their metaphorical wounds since the share price dropped 79% in that time. And some of the more recent buyers are probably worried, too, with the stock falling 51% in the last year.
Now let's have a look at the company's fundamentals, and see if the long term shareholder return has matched the performance of the underlying business.
View our latest analysis for Astro Malaysia Holdings Berhad
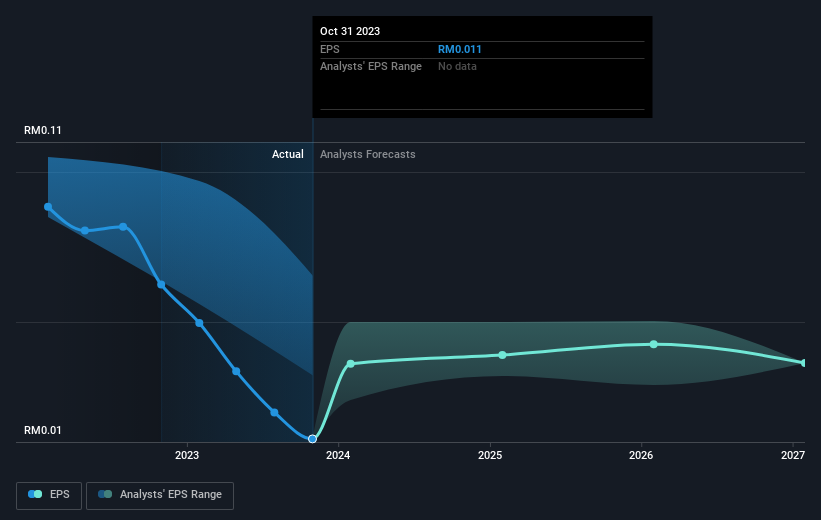
There is no denying that markets are sometimes efficient, but prices do not always reflect underlying business performance. One flawed but reasonable way to assess how sentiment around a company has changed is to compare the earnings per share (EPS) with the share price.
During the five years over which the share price declined, Astro Malaysia Holdings Berhad's earnings per share (EPS) dropped by 36% each year. This fall in the EPS is worse than the 27% compound annual share price fall. So investors might expect EPS to bounce back -- or they may have previously foreseen the EPS decline.
You can see below how EPS has changed over time (discover the exact values by clicking on the image).
This free interactive report on Astro Malaysia Holdings Berhad's earnings, revenue and cash flow is a great place to start, if you want to investigate the stock further.
What About The Total Shareholder Return (TSR)?
We'd be remiss not to mention the difference between Astro Malaysia Holdings Berhad's total shareholder return (TSR) and its share price return. The TSR attempts to capture the value of dividends (as if they were reinvested) as well as any spin-offs or discounted capital raisings offered to shareholders. Its history of dividend payouts mean that Astro Malaysia Holdings Berhad's TSR, which was a 72% drop over the last 5 years, was not as bad as the share price return.
A Different Perspective
Investors in Astro Malaysia Holdings Berhad had a tough year, with a total loss of 51%, against a market gain of about 14%. However, keep in mind that even the best stocks will sometimes underperform the market over a twelve month period. Regrettably, last year's performance caps off a bad run, with the shareholders facing a total loss of 12% per year over five years. Generally speaking long term share price weakness can be a bad sign, though contrarian investors might want to research the stock in hope of a turnaround. I find it very interesting to look at share price over the long term as a proxy for business performance. But to truly gain insight, we need to consider other information, too. Case in point: We've spotted 3 warning signs for Astro Malaysia Holdings Berhad you should be aware of, and 1 of them makes us a bit uncomfortable.
For those who like to find winning investments this free list of growing companies with recent insider purchasing, could be just the ticket.
Please note, the market returns quoted in this article reflect the market weighted average returns of stocks that currently trade on Malaysian exchanges.
Have feedback on this article? Concerned about the content? Get in touch with us directly. Alternatively, email editorial-team (at) simplywallst.com.
This article by Simply Wall St is general in nature. We provide commentary based on historical data and analyst forecasts only using an unbiased methodology and our articles are not intended to be financial advice. It does not constitute a recommendation to buy or sell any stock, and does not take account of your objectives, or your financial situation. We aim to bring you long-term focused analysis driven by fundamental data. Note that our analysis may not factor in the latest price-sensitive company announcements or qualitative material. Simply Wall St has no position in any stocks mentioned.
