
 Yahoo Finance
 Assurant (AIZ) Q1 Earnings Top Estimates, Revenues Rise Y/Y
Assurant, Inc. AIZ reported first-quarter 2023 net operating income of $3.49 per share, which beat the Zacks Consensus Estimate by 55% and our estimate of $2.62. The bottom line decreased 12.3% from the year-ago quarter. The decrease was primarily due to lower segment earnings, a higher effective tax rate and an increase in depreciation expense. It was partially offset by share repurchases from previous quarters.
Assurant, Inc. Price, Consensus and EPS Surprise
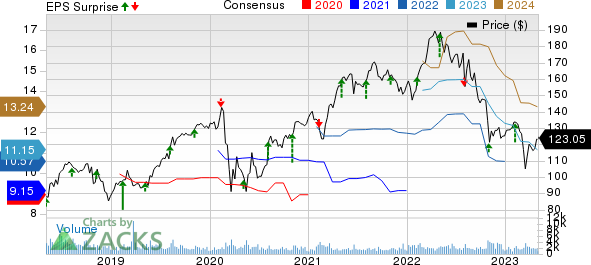
Assurant, Inc. price-consensus-eps-surprise-chart | Assurant, Inc. Quote
Quarterly results benefited from higher net earned premiums, fees and other income and net investment income. It was partially offset by higher catastrophe events, improved claims costs within extended service contracts and the unfavorable impact of foreign exchange.
Total revenues increased 4.2% year over year to $2.6 billion, driven by higher net earned premiums, fees and other income and net investment income. The top line beat the Zacks Consensus Estimate by 2.2% and matched our estimate of $2.6 billion.
Net investment income was up 21.9% year over year to $105.2 million. The figure was higher than our estimate of $97.5 million.
Total benefits, loss and expenses increased 8.1% to $2.5 billion, mainly on account of an increase in policyholder benefits, interest expense and underwriting, selling, general and administrative expenses. The figure was higher than our estimate of $2.3 billion.
Segmental Performance
Revenues at Global Housing increased 10.5% year over year to $526.5 million, primarily driven by higher net earned premiums, fees and other income and net investment income. The figure was lower than our estimate of $582.2 million.
Adjusted EBITDA of $68.4 million decreased 34% year over year due to a $43.3 million increase in reportable catastrophes from severe weather and tornado events. The figure was lower than our estimate of $115.1 million.
Revenues at Global Lifestyle increased 3.5% year over year to $2.1 billion. The increase was primarily driven by higher net earned premiums, fees and other income and net investment income. The figure was higher than our estimate of $2 billion.
Adjusted EBITDA of $198.9 million decreased 12% year over year. The decrease was primarily due to lower Connected Living results mainly because of an increase in claims costs within extended service contracts, weaker international performance from Asia Pacific and the unfavorable impact of foreign exchange. Global Automotive also declined from ongoing higher claims costs. The downside was partially offset by higher investment income.
Adjusted EBITDA loss at Corporate & Other was $24.4 million, wider than the year-ago quarter’s adjusted EBITDA loss of $22.2 million. The wider loss was due to lower investment income from lower asset balances.
Financial Position
Liquidity was $383 million as of Mar 31, 2023, which was $158 million higher than the company’s current targeted minimum level of $225 million.
Total assets decreased 0.6% to $32.9 billion as of Mar 31, 2023 from 2022 end.
Total shareholders’ equity came in at $4.4 billion, up 3.9% year over year.
Share Repurchase and Dividend Update
In the first quarter of 2023 and through Apr 28, 2023, Assurant did not repurchase any shares. It now has $274 million remaining under the current repurchase authorization.
Assurant’s total dividends amounted to $37 million in the first quarter of 2023.
2023 Guidance
Assurant expects adjusted EBITDA, excluding reportable catastrophes, to increase by low single-digits, driven by improved performance in Global Housing and more modest growth in Global Lifestyle.
Global Housing Adjusted EBITDA, excluding reportable catastrophes, is expected to grow. The growth is driven by improved performance in Homeowners reflecting higher lender-placed net earned premiums along with expense savings to be realized over the course of the year.
Global Lifestyle Adjusted EBITDA is expected to grow modestly, driven by Connected Living and Global Automotive.
Corporate and Other Adjusted EBITDA loss is expected to be approximately $105 million as the insurer continues to drive expense leverage.
Assurant expects adjusted earnings, excluding reportable catastrophes, per diluted share growth rate to be lower than Adjusted EBITDA, excluding reportable catastrophe growth. This is due to higher depreciation expense of nearly $114 million and a higher effective tax rate of approximately 22% to 24%, following a benefit of $9 million in 2022.
Interest expense is expected to be approximately $110 million, in line with 2022.
Given expectations for continued strong capital generation, Assurant expects to gradually resume repurchases later in the second quarter.
Zacks Rank
Assurant currently carries a Zacks Rank #3 (Hold). You can see the complete list of today’s Zacks #1 Rank (Strong Buy) stocks here.
Performance of Some Other Insurers
Chubb Limited CB reported first-quarter 2023 core operating income of $4.41 per share, which outpaced the Zacks Consensus Estimate by 0.9%. This outperformance was driven by higher premium revenues and improved net investment income. The bottom line improved 15.1% from the year-ago quarter. Net premiums written improved 16.6% year over year to $10.7 billion in the quarter. The figure was higher than our estimate of $10.1 billion. Net premiums earned rose 16.1% to $10.1 billion. The figure was higher than our estimate of $9.4 billion. Net investment income was $1.11 billion, up 34.7%. The figure was higher than our estimate of $957.3 million.
Property and casualty (P&C) underwriting income was $1.21 billion, down 5.5% from the year-ago quarter. Global P&C underwriting income, excluding Agriculture, was $1.2 billion, down 1.6%. Chubb incurred an after-tax catastrophe loss of $382 million, wider than the year-ago catastrophe loss of $290 million. The combined ratio deteriorated 200 basis points (bps) on a year-over-year basis to 86.3% in the quarter under review.
AXIS Capital Holdings Limited AXS posted first-quarter 2023 operating income of $2.33 per share, beating the Zacks Consensus Estimate by 23.2%. The bottom line increased 11.5% year over year. Total operating revenues of $1.3 billion missed the Zacks Consensus Estimate by 6.7%. The top line, however, rose 0.6% year over year on higher net investment income. Net investment income increased 47.2% year over year to $134 million, primarily attributable to a rise in income from fixed maturities due to increased yields.
Total expenses in the quarter under review increased 1.9% year over year to $1.14 billion, attributable to higher interest expense and financing costs. Pre-tax catastrophe and weather-related losses and net of reinsurance were $38 million, primarily attributable to New Zealand floods, Cyclone Gabrielle and other weather-related events. This compares favorably with the year-ago loss of $60 million. AXIS Capital’s underwriting income of $139.4 million increased 0.4% year over year. The combined ratio improved 50 bps to 90.9.
First American Financial Corporation FAF reported first-quarter 2023 operating income per share of 49 cents, which beat the Zacks Consensus Estimate by a cent. The bottom line decreased 58.1% year over year. Operating revenues of $1.4 billion decreased 29% year over year. The top line beat the Zacks Consensus Estimate by 1.5%. The figure was in line with our estimate.
Investment income was $125 million in the first quarter, more than double year over year. The increase was primarily due to rising interest rates, which drove higher interest income from the cash and investment portfolio, escrow balances and tax-deferred property exchange balances. The impact of higher interest rates was partly offset by lower average balances, primarily in the company’s escrow and tax-deferred exchange balances. The figure was lower than our estimate of $144 million.
Want the latest recommendations from Zacks Investment Research? Today, you can download 7 Best Stocks for the Next 30 Days. Click to get this free report
Chubb Limited (CB) : Free Stock Analysis Report
Assurant, Inc. (AIZ) : Free Stock Analysis Report
Axis Capital Holdings Limited (AXS) : Free Stock Analysis Report
First American Financial Corporation (FAF) : Free Stock Analysis Report
