
 Yahoo Finance
 AMEN Properties Inc's Dividend Analysis
Assessing the Sustainability of AMEN Properties Inc's Upcoming Dividend
AMEN Properties Inc (AMEN) recently announced a dividend of $10 per share, payable on 2024-01-05, with the ex-dividend date set for 2023-12-26. As investors look forward to this upcoming payment, the spotlight also shines on the company's dividend history, yield, and growth rates. Using the data from GuruFocus, let's look into AMEN Properties Inc's dividend performance and assess its sustainability.
Company Profile: AMEN Properties Inc
This Powerful Chart Made Peter Lynch 29% A Year For 13 Years
How to calculate the intrinsic value of a stock?
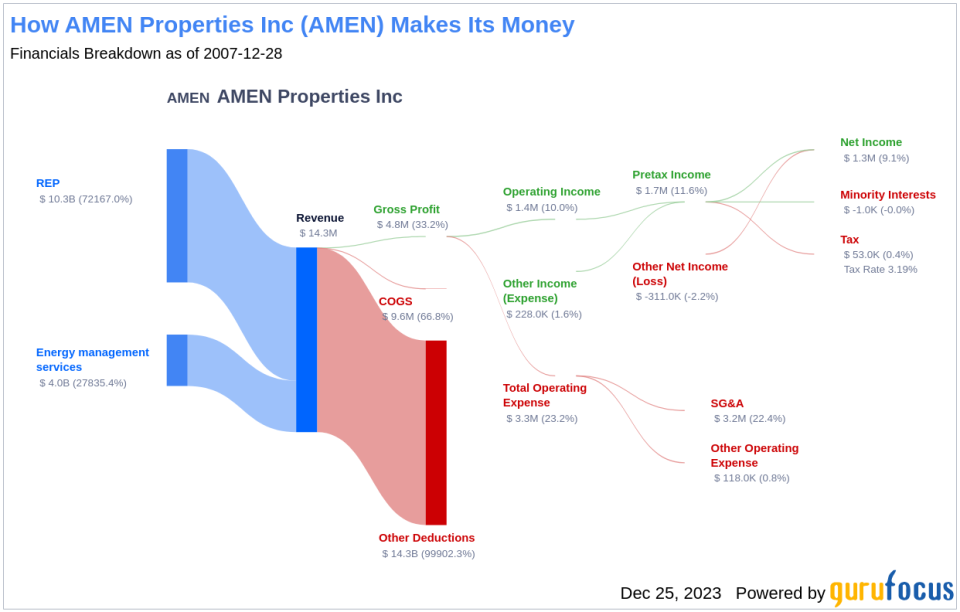
AMEN Properties Inc acquires investments in commercial real estate, natural gas properties, and other energy-related business properties. It derives revenue from oil and gas, a sector known for its volatility but also for its potential for high dividends to shareholders.
AMEN Properties Inc's Dividend Track Record
AMEN Properties Inc has maintained a consistent dividend payment record since 2011, distributing dividends on a quarterly basis. This consistency is a positive sign for investors looking for stable income streams.
Below is a chart showing annual Dividends Per Share for tracking historical trends.
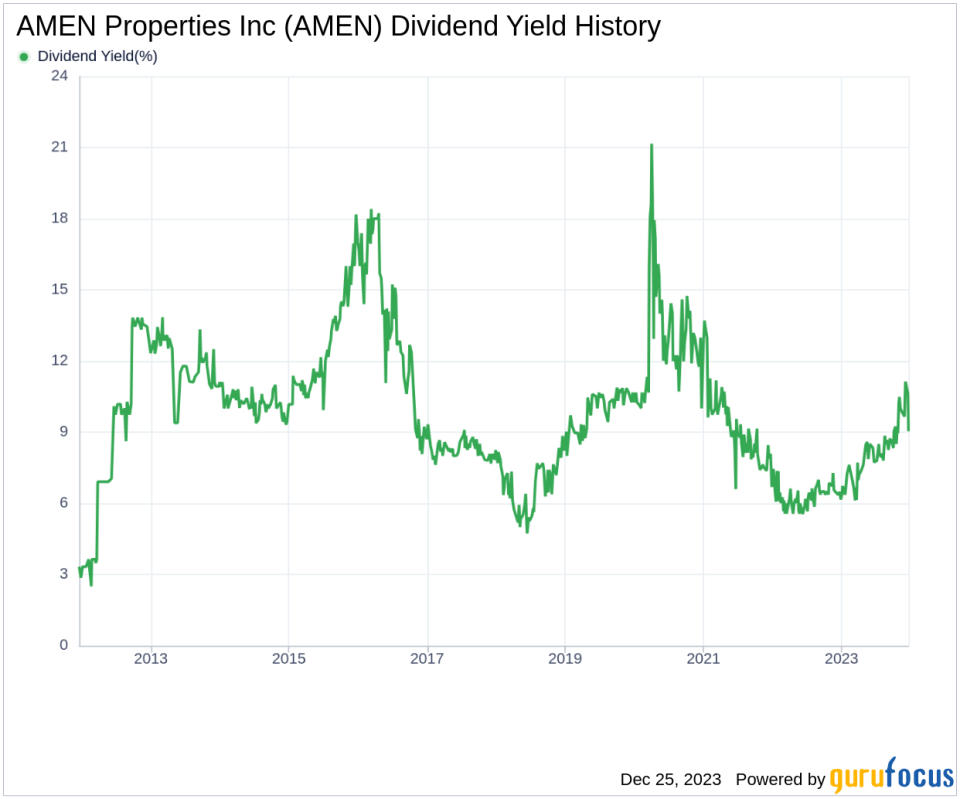
Dividend Yield and Growth Analysis
As of today, AMEN Properties Inc currently has a 12-month trailing dividend yield of 8.95% and a 12-month forward dividend yield of 8.42%. This suggests an expectation of a slight decrease in dividend payments over the next 12 months.
Over the past three years, AMEN Properties Inc's annual dividend growth rate was -20.60%. Extended to a five-year horizon, this rate increased to -9.00% per year. And over the past decade, AMEN Properties Inc's annual dividends per share growth rate stands at -5.90%.
Based on AMEN Properties Inc's dividend yield and five-year growth rate, the 5-year yield on cost of AMEN Properties Inc stock as of today is approximately 5.59%.
Evaluating Dividend Sustainability
To assess the sustainability of the dividend, one needs to evaluate the company's payout ratio. The dividend payout ratio provides insights into the portion of earnings the company distributes as dividends. A lower ratio suggests that the company retains a significant part of its earnings, thereby ensuring the availability of funds for future growth and unexpected downturns. As of 2023-03-31, AMEN Properties Inc's dividend payout ratio is 0.00.
AMEN Properties Inc's profitability rank, which offers an understanding of the company's earnings prowess relative to its peers, is 4 out of 10 as of 2023-03-31. This suggests that the dividend may not be sustainable, although the company has reported net profit in 9 years out of the past 10 years.
AMEN Properties Inc's Growth Prospects
To ensure the sustainability of dividends, a company must have robust growth metrics. AMEN Properties Inc's growth rank of 4 out of 10 suggests that the company has poor growth prospects and thus, the dividend may not be sustainable.
Revenue is the lifeblood of any company, and AMEN Properties Inc's revenue per share, combined with the 3-year revenue growth rate, indicates a strong revenue model. AMEN Properties Inc's revenue has increased by approximately 14.80% per year on average, outperforming approximately 57.54% of global competitors.
The company's 3-year EPS growth rate showcases its capability to grow its earnings, a critical component for sustaining dividends in the long run. During the past three years, AMEN Properties Inc's earnings increased by approximately 397.40% per year on average, outperforming approximately 99.18% of global competitors.
Lastly, the company's 5-year EBITDA growth rate of 2.90%, outperforms approximately 33.01% of global competitors.
Concluding Insights on AMEN Properties Inc's Dividends
In conclusion, AMEN Properties Inc's robust dividend yield is an attractive feature for income-focused investors, although the negative growth rates in dividends per share raise questions about long-term sustainability. The company's strong revenue and earnings growth rates, coupled with a low payout ratio, provide some reassurance. However, the modest profitability and growth ranks suggest that investors should keep an eye on the company's future performance and strategic initiatives. As AMEN Properties Inc navigates the volatile energy sector, will its dividends continue to be a reliable source of income for shareholders? This is a question that value investors may want to ponder as they consider the stock's place in their portfolios.
GuruFocus Premium users can screen for high-dividend yield stocks using the High Dividend Yield Screener.
This article, generated by GuruFocus, is designed to provide general insights and is not tailored financial advice. Our commentary is rooted in historical data and analyst projections, utilizing an impartial methodology, and is not intended to serve as specific investment guidance. It does not formulate a recommendation to purchase or divest any stock and does not consider individual investment objectives or financial circumstances. Our objective is to deliver long-term, fundamental data-driven analysis. Be aware that our analysis might not incorporate the most recent, price-sensitive company announcements or qualitative information. GuruFocus holds no position in the stocks mentioned herein.
This article first appeared on GuruFocus.
