
 Yahoo Finance
 AEM Holdings (SGX:AWX) Will Want To Turn Around Its Return Trends
Did you know there are some financial metrics that can provide clues of a potential multi-bagger? Typically, we'll want to notice a trend of growing return on capital employed (ROCE) and alongside that, an expanding base of capital employed. If you see this, it typically means it's a company with a great business model and plenty of profitable reinvestment opportunities. However, after briefly looking over the numbers, we don't think AEM Holdings (SGX:AWX) has the makings of a multi-bagger going forward, but let's have a look at why that may be.
What Is Return On Capital Employed (ROCE)?
For those who don't know, ROCE is a measure of a company's yearly pre-tax profit (its return), relative to the capital employed in the business. The formula for this calculation on AEM Holdings is:
Return on Capital Employed = Earnings Before Interest and Tax (EBIT) ÷ (Total Assets - Current Liabilities)
0.044 = S$29m ÷ (S$766m - S$96m) (Based on the trailing twelve months to September 2023).
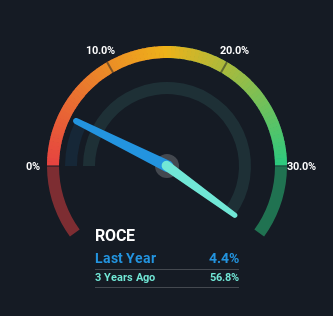
So, AEM Holdings has an ROCE of 4.4%. In absolute terms, that's a low return and it also under-performs the Semiconductor industry average of 6.4%.
See our latest analysis for AEM Holdings
In the above chart we have measured AEM Holdings' prior ROCE against its prior performance, but the future is arguably more important. If you'd like, you can check out the forecasts from the analysts covering AEM Holdings here for free.
So How Is AEM Holdings' ROCE Trending?
In terms of AEM Holdings' historical ROCE movements, the trend isn't fantastic. To be more specific, ROCE has fallen from 56% over the last five years. And considering revenue has dropped while employing more capital, we'd be cautious. If this were to continue, you might be looking at a company that is trying to reinvest for growth but is actually losing market share since sales haven't increased.
On a related note, AEM Holdings has decreased its current liabilities to 13% of total assets. That could partly explain why the ROCE has dropped. What's more, this can reduce some aspects of risk to the business because now the company's suppliers or short-term creditors are funding less of its operations. Some would claim this reduces the business' efficiency at generating ROCE since it is now funding more of the operations with its own money.
What We Can Learn From AEM Holdings' ROCE
From the above analysis, we find it rather worrisome that returns on capital and sales for AEM Holdings have fallen, meanwhile the business is employing more capital than it was five years ago. The market must be rosy on the stock's future because even though the underlying trends aren't too encouraging, the stock has soared 254%. Regardless, we don't feel too comfortable with the fundamentals so we'd be steering clear of this stock for now.
On a final note, we've found 1 warning sign for AEM Holdings that we think you should be aware of.
For those who like to invest in solid companies, check out this free list of companies with solid balance sheets and high returns on equity.
Have feedback on this article? Concerned about the content? Get in touch with us directly. Alternatively, email editorial-team (at) simplywallst.com.
This article by Simply Wall St is general in nature. We provide commentary based on historical data and analyst forecasts only using an unbiased methodology and our articles are not intended to be financial advice. It does not constitute a recommendation to buy or sell any stock, and does not take account of your objectives, or your financial situation. We aim to bring you long-term focused analysis driven by fundamental data. Note that our analysis may not factor in the latest price-sensitive company announcements or qualitative material. Simply Wall St has no position in any stocks mentioned.
