
 Yahoo Finance
 Acesian Partners (Catalist:5FW) Might Have The Makings Of A Multi-Bagger
What are the early trends we should look for to identify a stock that could multiply in value over the long term? One common approach is to try and find a company with returns on capital employed (ROCE) that are increasing, in conjunction with a growing amount of capital employed. Put simply, these types of businesses are compounding machines, meaning they are continually reinvesting their earnings at ever-higher rates of return. With that in mind, we've noticed some promising trends at Acesian Partners (Catalist:5FW) so let's look a bit deeper.
Understanding Return On Capital Employed (ROCE)
If you haven't worked with ROCE before, it measures the 'return' (pre-tax profit) a company generates from capital employed in its business. Analysts use this formula to calculate it for Acesian Partners:
Return on Capital Employed = Earnings Before Interest and Tax (EBIT) ÷ (Total Assets - Current Liabilities)
0.16 = S$3.7m ÷ (S$30m - S$6.1m) (Based on the trailing twelve months to December 2023).
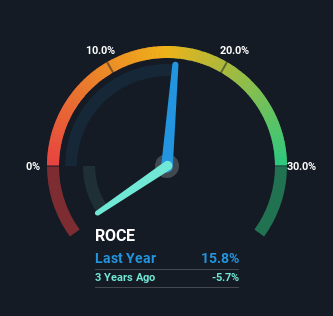
Thus, Acesian Partners has an ROCE of 16%. In absolute terms, that's a satisfactory return, but compared to the Machinery industry average of 6.6% it's much better.
View our latest analysis for Acesian Partners
While the past is not representative of the future, it can be helpful to know how a company has performed historically, which is why we have this chart above. If you'd like to look at how Acesian Partners has performed in the past in other metrics, you can view this free graph of Acesian Partners' past earnings, revenue and cash flow.
What Can We Tell From Acesian Partners' ROCE Trend?
Investors would be pleased with what's happening at Acesian Partners. Over the last five years, returns on capital employed have risen substantially to 16%. Basically the business is earning more per dollar of capital invested and in addition to that, 72% more capital is being employed now too. So we're very much inspired by what we're seeing at Acesian Partners thanks to its ability to profitably reinvest capital.
On a related note, the company's ratio of current liabilities to total assets has decreased to 21%, which basically reduces it's funding from the likes of short-term creditors or suppliers. So shareholders would be pleased that the growth in returns has mostly come from underlying business performance.
Our Take On Acesian Partners' ROCE
All in all, it's terrific to see that Acesian Partners is reaping the rewards from prior investments and is growing its capital base. Since the stock has returned a staggering 169% to shareholders over the last five years, it looks like investors are recognizing these changes. Therefore, we think it would be worth your time to check if these trends are going to continue.
One more thing, we've spotted 2 warning signs facing Acesian Partners that you might find interesting.
If you want to search for solid companies with great earnings, check out this free list of companies with good balance sheets and impressive returns on equity.
Have feedback on this article? Concerned about the content? Get in touch with us directly. Alternatively, email editorial-team (at) simplywallst.com.
This article by Simply Wall St is general in nature. We provide commentary based on historical data and analyst forecasts only using an unbiased methodology and our articles are not intended to be financial advice. It does not constitute a recommendation to buy or sell any stock, and does not take account of your objectives, or your financial situation. We aim to bring you long-term focused analysis driven by fundamental data. Note that our analysis may not factor in the latest price-sensitive company announcements or qualitative material. Simply Wall St has no position in any stocks mentioned.
Have feedback on this article? Concerned about the content? Get in touch with us directly. Alternatively, email editorial-team@simplywallst.com
