
 Yahoo Finance
 Accelya Solutions India And Two More High Yield Dividend Stocks
The Indian market has shown robust growth, climbing 1.6% in the last week and an impressive 44% over the past year, with earnings expected to grow by 16% annually. In such a thriving environment, high-yield dividend stocks like Accelya Solutions India can be particularly appealing for investors looking for both stability and potential income.
Top 10 Dividend Stocks In India
Name | Dividend Yield | Dividend Rating |
Bhansali Engineering Polymers (BSE:500052) | 4.24% | ★★★★★★ |
Castrol India (BSE:500870) | 4.00% | ★★★★★☆ |
HCL Technologies (NSEI:HCLTECH) | 3.81% | ★★★★★☆ |
D-Link (India) (NSEI:DLINKINDIA) | 3.24% | ★★★★★☆ |
ITC (NSEI:ITC) | 3.21% | ★★★★★☆ |
Indian Oil (NSEI:IOC) | 8.38% | ★★★★★☆ |
Balmer Lawrie Investments (BSE:532485) | 3.88% | ★★★★★☆ |
VST Industries (BSE:509966) | 3.74% | ★★★★★☆ |
Redington (NSEI:REDINGTON) | 3.53% | ★★★★★☆ |
PTC India (NSEI:PTC) | 3.50% | ★★★★★☆ |
Click here to see the full list of 21 stocks from our Top Dividend Stocks screener.
Let's uncover some gems from our specialized screener.
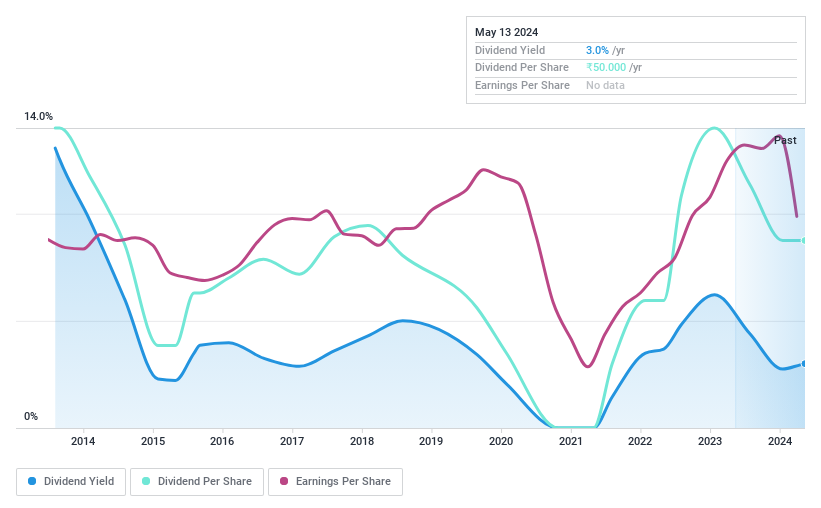
Accelya Solutions India
Simply Wall St Dividend Rating: ★★★★☆☆
Overview: Accelya Solutions India Limited provides software solutions to the airline, cargo, and travel industries across regions including the Asia Pacific, the Middle East, Africa, the Americas, and Europe, with a market capitalization of approximately ₹24.18 billion.
Operations: Accelya Solutions India Limited generates revenue primarily from its Travel and Transportation Vertical, amounting to approximately ₹5.06 billion.
Dividend Yield: 3.1%
Accelya Solutions India has demonstrated a fluctuating dividend track record over the past decade, with recent earnings showing significant declines in net income and earnings per share for Q3 2024. Despite these challenges, the company maintains a dividend yield of 3.09%, which ranks in the top 25% of Indian dividend payers. The dividends are supported by an earnings payout ratio of 86.6% and a cash payout ratio of 67.6%, suggesting that while payments are currently covered, the sustainability under declining profits may be at risk.
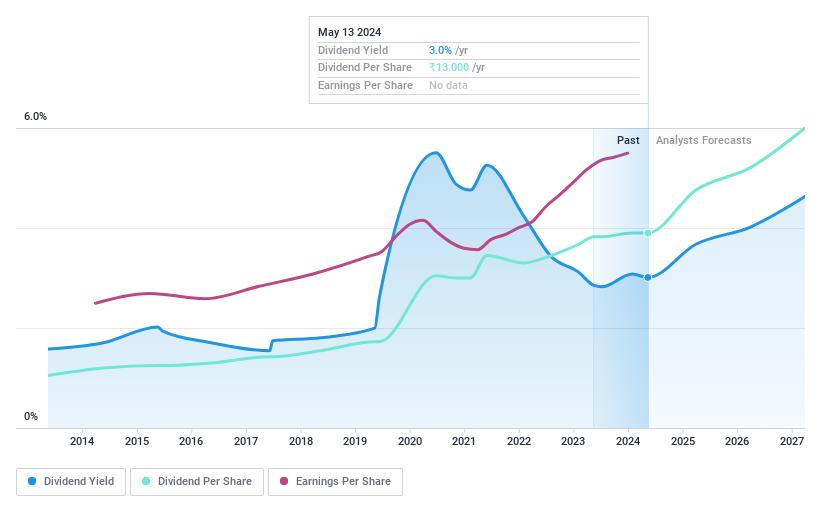
ITC
Simply Wall St Dividend Rating: ★★★★★☆
Overview: ITC Limited operates in diverse sectors including fast-moving consumer goods, hotels, paperboards and paper, packaging, agri-businesses, and information technology across India and globally, with a market capitalization of approximately ₹5.36 trillion.
Operations: ITC Limited generates revenue from several segments including ₹3.31 billion from FMCG - Cigarettes, ₹2.06 billion from FMCG - Others, ₹849.26 million from Paperboards, Paper & Packaging, ₹298.11 million from Hotels, and ₹1.66 billion from Agri Business.
Dividend Yield: 3.2%
ITC Limited, with a dividend yield of 3.21%, ranks in the top 25% of Indian dividend payers. Despite a stable history of increasing dividends over the past decade, its dividend sustainability is questionable as both earnings and cash flows struggle to cover payouts, evidenced by payout ratios of 78.8% and 109.7%, respectively. Recent financials show growth with FY2024 net income at INR 204.59 billion, up from INR 191.92 billion last year; however, this growth does not fully alleviate concerns over its high payout commitments.
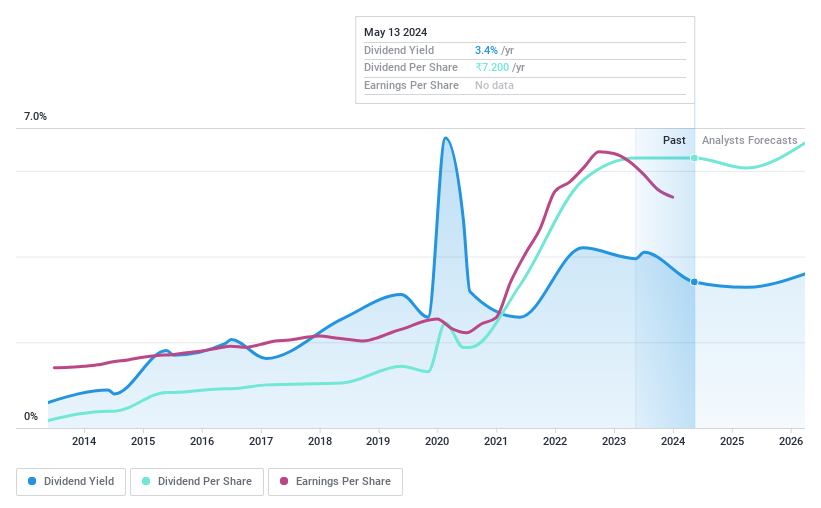
Redington
Simply Wall St Dividend Rating: ★★★★★☆
Overview: Redington Limited operates as a supply chain solutions provider in India and globally, with a market capitalization of approximately ₹159.36 billion.
Operations: Redington Limited generates its revenue through supply chain solutions both in India and across various international markets.
Dividend Yield: 3.5%
Redington's dividend sustainability is supported by a payout ratio of 40.4% and a cash payout ratio of 58.8%, indicating that dividends are well-covered by both earnings and cash flows, despite a history of volatility in dividend payments over the past decade. Recent financial results show steady performance with year-over-year increases in sales and net income for Q4 2024, suggesting potential stability moving forward. However, the company's dividends have been historically unreliable, which could concern investors looking for consistent returns.
Get an in-depth perspective on Redington's performance by reading our dividend report here.
Our valuation report unveils the possibility Redington's shares may be trading at a discount.
Taking Advantage
Get an in-depth perspective on all 21 Top Dividend Stocks by using our screener here.
Already own these companies? Bring clarity to your investment decisions by linking up your portfolio with Simply Wall St, where you can monitor all the vital signs of your stocks effortlessly.
Unlock the power of informed investing with Simply Wall St, your free guide to navigating stock markets worldwide.
Want To Explore Some Alternatives?
Explore high-performing small cap companies that haven't yet garnered significant analyst attention.
Fuel your portfolio with companies showing strong growth potential, backed by optimistic outlooks both from analysts and management.
Find companies with promising cash flow potential yet trading below their fair value.
This article by Simply Wall St is general in nature. We provide commentary based on historical data and analyst forecasts only using an unbiased methodology and our articles are not intended to be financial advice. It does not constitute a recommendation to buy or sell any stock, and does not take account of your objectives, or your financial situation. We aim to bring you long-term focused analysis driven by fundamental data. Note that our analysis may not factor in the latest price-sensitive company announcements or qualitative material. Simply Wall St has no position in any stocks mentioned.
Companies discussed in this article include NSEI:ACCELYA NSEI:ITC and NSEI:REDINGTON.
Have feedback on this article? Concerned about the content? Get in touch with us directly. Alternatively, email editorial-team@simplywallst.com
