
 Yahoo Finance
 The 23% return delivered to Exelixis' (NASDAQ:EXEL) shareholders actually lagged YoY earnings growth
By buying an index fund, you can roughly match the market return with ease. But if you buy good businesses at attractive prices, your portfolio returns could exceed the average market return. For example, the Exelixis, Inc. (NASDAQ:EXEL) share price is up 23% in the last three years, clearly besting the market return of around 14% (not including dividends). However, more recent returns haven't been as impressive as that, with the stock returning just 18% in the last year.
On the back of a solid 7-day performance, let's check what role the company's fundamentals have played in driving long term shareholder returns.
See our latest analysis for Exelixis
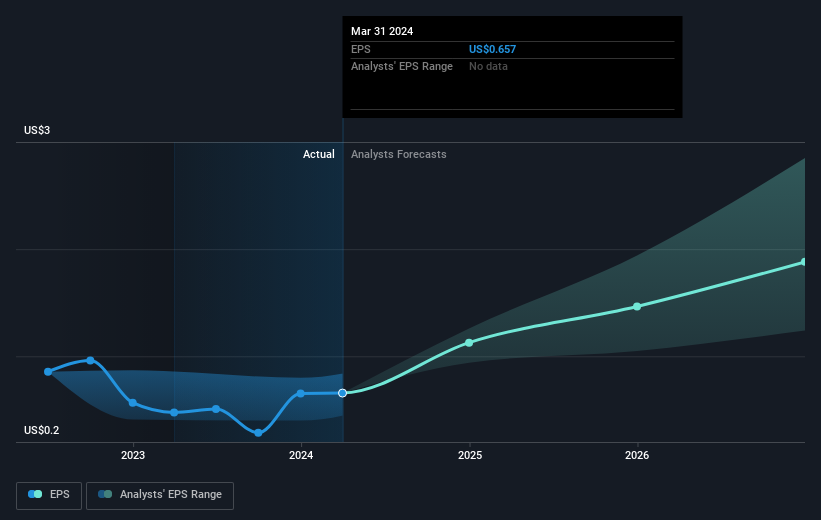
While the efficient markets hypothesis continues to be taught by some, it has been proven that markets are over-reactive dynamic systems, and investors are not always rational. One flawed but reasonable way to assess how sentiment around a company has changed is to compare the earnings per share (EPS) with the share price.
During three years of share price growth, Exelixis achieved compound earnings per share growth of 50% per year. This EPS growth is higher than the 7% average annual increase in the share price. Therefore, it seems the market has moderated its expectations for growth, somewhat.
The graphic below depicts how EPS has changed over time (unveil the exact values by clicking on the image).
We know that Exelixis has improved its bottom line over the last three years, but what does the future have in store? This free interactive report on Exelixis' balance sheet strength is a great place to start, if you want to investigate the stock further.
A Different Perspective
Exelixis shareholders are up 18% for the year. But that was short of the market average. On the bright side, that's still a gain, and it's actually better than the average return of 1.0% over half a decade This suggests the company might be improving over time. It's always interesting to track share price performance over the longer term. But to understand Exelixis better, we need to consider many other factors. Consider for instance, the ever-present spectre of investment risk. We've identified 1 warning sign with Exelixis , and understanding them should be part of your investment process.
For those who like to find winning investments this free list of undervalued companies with recent insider purchasing, could be just the ticket.
Please note, the market returns quoted in this article reflect the market weighted average returns of stocks that currently trade on American exchanges.
Have feedback on this article? Concerned about the content? Get in touch with us directly. Alternatively, email editorial-team (at) simplywallst.com.
This article by Simply Wall St is general in nature. We provide commentary based on historical data and analyst forecasts only using an unbiased methodology and our articles are not intended to be financial advice. It does not constitute a recommendation to buy or sell any stock, and does not take account of your objectives, or your financial situation. We aim to bring you long-term focused analysis driven by fundamental data. Note that our analysis may not factor in the latest price-sensitive company announcements or qualitative material. Simply Wall St has no position in any stocks mentioned.
Have feedback on this article? Concerned about the content? Get in touch with us directly. Alternatively, email editorial-team@simplywallst.com
