
 Yahoo Finance
 The 20% return this week takes SciDev's (ASX:SDV) shareholders five-year gains to 200%
When you buy a stock there is always a possibility that it could drop 100%. But when you pick a company that is really flourishing, you can make more than 100%. One great example is SciDev Limited (ASX:SDV) which saw its share price drive 200% higher over five years. On top of that, the share price is up 87% in about a quarter.
The past week has proven to be lucrative for SciDev investors, so let's see if fundamentals drove the company's five-year performance.
See our latest analysis for SciDev
SciDev wasn't profitable in the last twelve months, it is unlikely we'll see a strong correlation between its share price and its earnings per share (EPS). Arguably revenue is our next best option. Shareholders of unprofitable companies usually desire strong revenue growth. Some companies are willing to postpone profitability to grow revenue faster, but in that case one would hope for good top-line growth to make up for the lack of earnings.
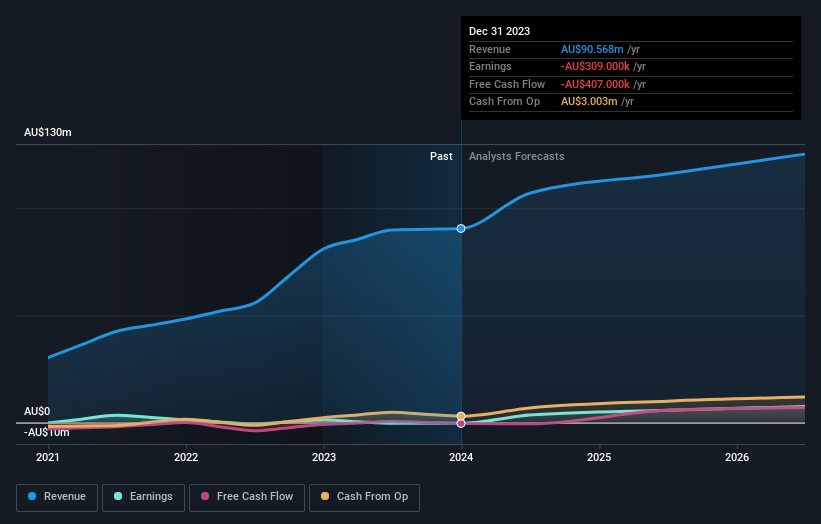
In the last 5 years SciDev saw its revenue grow at 48% per year. Even measured against other revenue-focussed companies, that's a good result. Meanwhile, its share price performance certainly reflects the strong growth, given the share price grew at 25% per year, compound, during the period. This suggests the market has well and truly recognized the progress the business has made. SciDev seems like a high growth stock - so growth investors might want to add it to their watchlist.
The company's revenue and earnings (over time) are depicted in the image below (click to see the exact numbers).
You can see how its balance sheet has strengthened (or weakened) over time in this free interactive graphic.
A Different Perspective
It's good to see that SciDev has rewarded shareholders with a total shareholder return of 33% in the last twelve months. That gain is better than the annual TSR over five years, which is 25%. Therefore it seems like sentiment around the company has been positive lately. Someone with an optimistic perspective could view the recent improvement in TSR as indicating that the business itself is getting better with time. It's always interesting to track share price performance over the longer term. But to understand SciDev better, we need to consider many other factors. For instance, we've identified 1 warning sign for SciDev that you should be aware of.
If you like to buy stocks alongside management, then you might just love this free list of companies. (Hint: many of them are unnoticed AND have attractive valuation).
Please note, the market returns quoted in this article reflect the market weighted average returns of stocks that currently trade on Australian exchanges.
Have feedback on this article? Concerned about the content? Get in touch with us directly. Alternatively, email editorial-team (at) simplywallst.com.
This article by Simply Wall St is general in nature. We provide commentary based on historical data and analyst forecasts only using an unbiased methodology and our articles are not intended to be financial advice. It does not constitute a recommendation to buy or sell any stock, and does not take account of your objectives, or your financial situation. We aim to bring you long-term focused analysis driven by fundamental data. Note that our analysis may not factor in the latest price-sensitive company announcements or qualitative material. Simply Wall St has no position in any stocks mentioned.
Have feedback on this article? Concerned about the content? Get in touch with us directly. Alternatively, email editorial-team@simplywallst.com
