
 Yahoo Finance
 12 States Where It’s Cheapest to Raise Kids in 2024

The cost of raising a family has always been higher than the cost of living being single or only married. This is for obvious reasons: more mouths to feed, more bodies to clothe, more shelter to provide, along with education expenses. The list goes on.
But not all U.S. states are created equal when it comes to the cost of raising kids. Some are drastically more affordable than others.
GOBankingRates examined each state’s average annual expenditures and the median income for families to find the cost of raising a family in every state and Washington, D.C. — as well as crime rates, high school graduation rates and more to find which might be the best and worst states to raise a family. From there, we narrowed down the top 12 cities with the lowest average annual expenditures for families.
Let’s take a look at some of the cheapest spots to settle down and raise your little ones:
Check Out: What the Upper Middle Class Makes in Different US Cities
Read Next: 7 Reasons You Should Consider a Financial Advisor — Even If You’re Not Wealthy

Kentucky
Population of families: 25.1%
High school graduation rate: 91.1%
Property crime per capita: 779
Median income for families: $70,178
Average annual expenditures for families: $30,122
Discover More: The 50 Happiest States in America and How Much It Costs to Live There
Find Out: 6 Unusual Ways To Make Extra Money (That Actually Work)
Wealthy people know the best money secrets. Learn how to copy them.

South Dakota
Population of families: 23.8%
High school graduation rate: 84.2%
Property crime per capita: 1,362
Median income for families: $81,756
Average annual expenditures for families: $30,012
Trending Now: Net Worth for Gen X: How To Tell If You’re Poor, Middle Class, Upper Middle Class or Rich
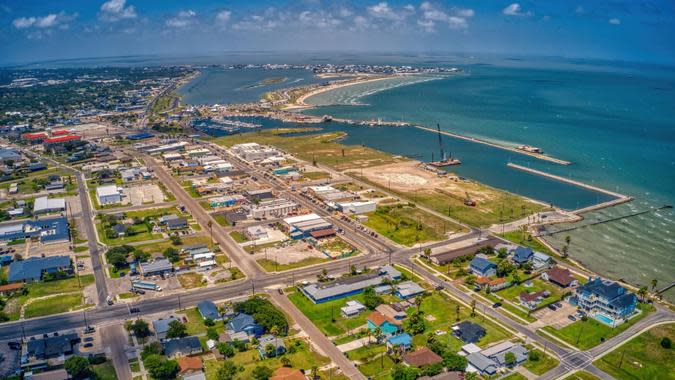
Texas
Population of families: 23.5%
High school graduation rate: 90%
Property crime per capita: 1,874
Median income for families: $80,498
Average annual expenditures for families: $30,001

West Virginia
One of the key ways to build wealth fast — and over the long term — is to earn passive income.
Population of families: 25.4%
High school graduation rate: 92.1%
Property crime per capita: 521
Median income for families: $65,845
Average annual expenditures for families: $29,988

Georgia
Population of families: 23.8%
High school graduation rate: 83.8%
Property crime per capita: 784
Median income for families: $78,834
Average annual expenditures for families: $29,930
Be Aware: 6 Reasons the Poor Stay Poor and Middle Class Doesn’t Become Wealthy

Oklahoma
Population of families: 24.4%
High school graduation rate: 80.8%
Property crime per capita: 1,964
Median income for families: $71,155
Average annual expenditures for families: $29,654
Missouri
Population of families: 25%
High school graduation rate: 89.5%
Property crime per capita: 1,871
Median income for families: $77,976
Average annual expenditures for families: $29,443

Alabama
Population of families: 24.4%
High school graduation rate: 90.6%
Property crime per capita: 1,275
Median income for families: $70,878
Average annual expenditures for families: $29,222
Discover More: 5 Changes That Could Be Coming for the Middle Class If Biden Is Reelected in 2024
Louisiana
Population of families: 24.3%
High school graduation rate: 82.9%
Property crime per capita: 1,481
Median income for families: $69,093
Average annual expenditures for families: $29,440

Mississippi
Population of families: 24.9%
High school graduation rate: 87.7%
Property crime per capita: 651
Median income for families: $62,802
Average annual expenditures for families: $28,985

Tennessee
Population of families: 24.6%
High school graduation rate: 90.4%
Property crime per capita: 1,890
Median income for families: $73,248
Average annual expenditures for families: $28,738
Explore More: I’m an Economist: Here Are My Predictions for Inflation If Biden Wins Again

Arkansas
Population of families: 24.9%
High school graduation rate: 88.8%
Property crime per capita: 1,933
Median income for families: $65,673
Average annual expenditures for families: $28,605
Daria Uhlig and Nicole Spector contributed to the reporting for this article.
Methodology: In order to find how much it costs to raise a family in all 50 states, GOBankingRates analyzed each state for a variety of factors, including [1] overall state cost of living index as sourced from the Missouri Economic and Research Information and [2] average expenditure costs for families with children as sourced from the Bureau of Labor Statistics Consumer Expenditure Survey to find the overall expenditure costs for each state; [3] total population, household population, family population and median family with children income, all sourced from the U.S. Census American Consumer Survey, then calculated what percentage of the population are families with children; [4] violent crime by state and [5] property crime by state, both sourced from the Federal Bureau of Investigation’s Crime Data Explorer and used to calculated the violent crime rate per 100,000 and property crime rate per 100,000; [6] High school graduation rates by state, as sourced from the U.S. News and World Report for High School Graduation Rates; and [7] average single family home value for October 2023, as sourced from the Zillow Home Value Index. The average overall expenditure cost was scored, the percentage of the population being families with children was scored, the high school graduation rate was scored, the NAEP math score was scored, the violent crime rate per 100,000 was scored, the property crime rate per 100,000 was scored, the median family income was scored, and the average single family home value for October 2023 was scored. All the scores were combined and sorted to show how much it costs to raise a family in every state. All data was collected and is up to date as of May 13, 2024.
More From GOBankingRates
This article originally appeared on GOBankingRates.com: 12 States Where It’s Cheapest to Raise Kids in 2024
