
 Yahoo Finance
 Zoetis Inc's Dividend Analysis
Exploring the Sustainability and Growth of Zoetis Inc's Dividends
Zoetis Inc (NYSE:ZTS) recently announced a dividend of $0.43 per share, payable on 2024-06-04, with the ex-dividend date set for 2024-04-18. As investors look forward to this upcoming payment, the spotlight also shines on the company's dividend history, yield, and growth rates. Using the data from GuruFocus, let's look into Zoetis Inc's dividend performance and assess its sustainability.
What Does Zoetis Inc Do?
This Powerful Chart Made Peter Lynch 29% A Year For 13 Years
How to calculate the intrinsic value of a stock?
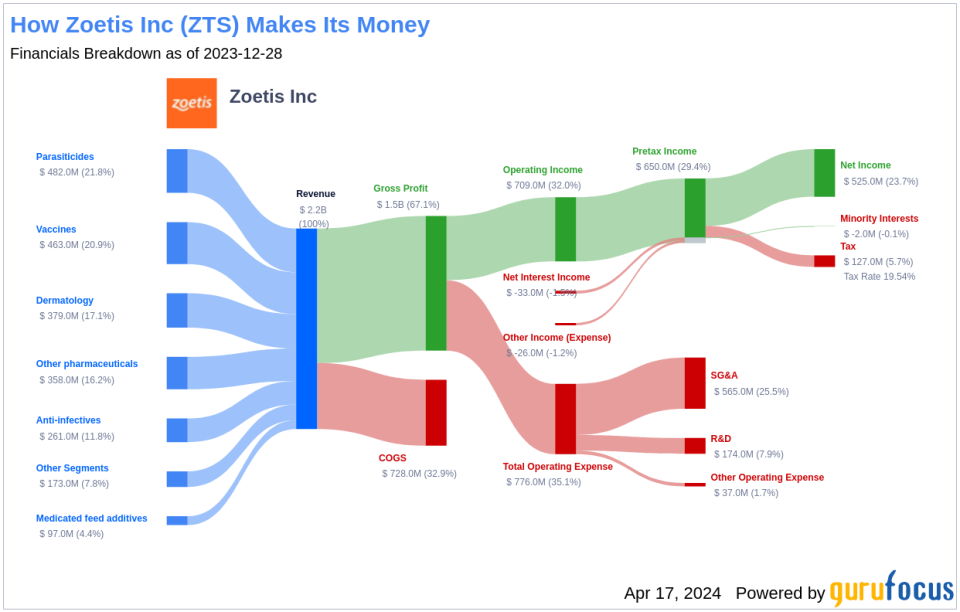
Zoetis sells anti-infectives, vaccines, parasiticides, diagnostics, and other health products for animals. The firm earns roughly 35% of total revenue from production animals (cattle, pigs, poultry, and so on), and nearly 65% from companion animal (dogs, horses, cats) products. Its U.S. business is heavily skewed toward companion animals, while its international business is slightly skewed toward production animals. The firm has the largest market share in the industry and was previously Pfizer's animal health unit.
A Glimpse at Zoetis Inc's Dividend History
Zoetis Inc has maintained a consistent dividend payment record since 2013. Dividends are currently distributed on a quarterly basis. Zoetis Inc has increased its dividend each year since 2013. The stock is thus listed as a dividend achiever, an honor that is given to companies that have increased their dividend each year for at least the past 11 years. Below is a chart showing annual Dividends Per Share for tracking historical trends.
Breaking Down Zoetis Inc's Dividend Yield and Growth
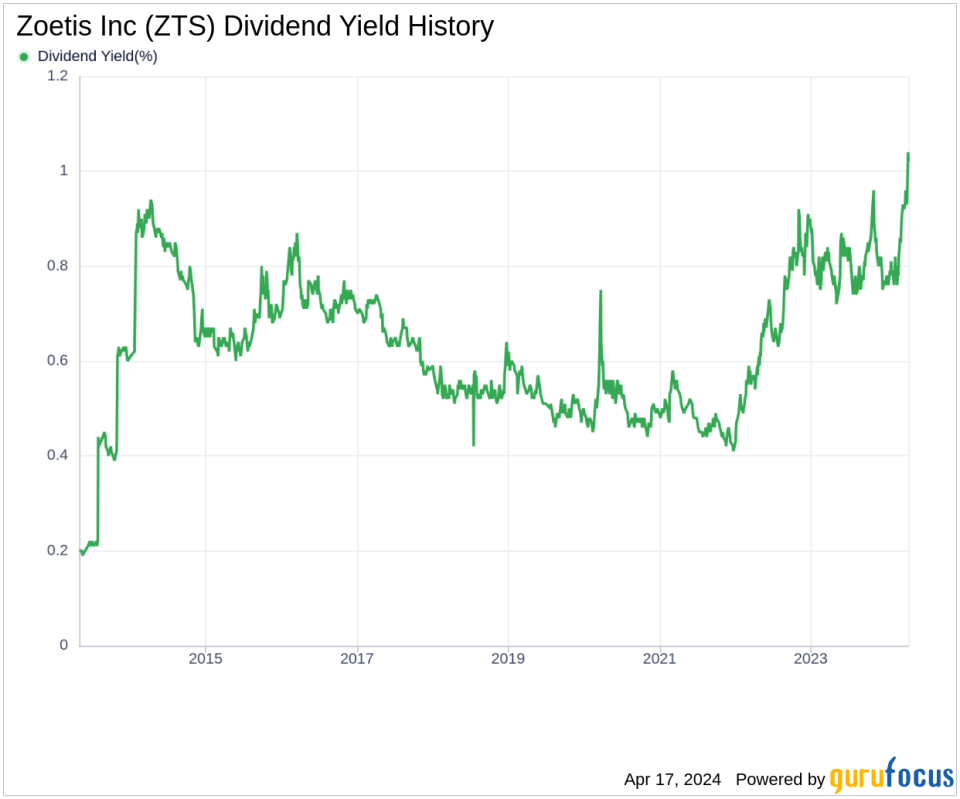
As of today, Zoetis Inc currently has a 12-month trailing dividend yield of 1.02% and a 12-month forward dividend yield of 1.12%. This suggests an expectation of increased dividend payments over the next 12 months. Zoetis Inc's dividend yield of 1.02% is near a 10-year high and outperforms than 30.12% of global competitors in the Drug Manufacturers industry, suggesting that the company's dividend yield stands out as an attractive proposition for income investors.
Over the past three years, Zoetis Inc's annual dividend growth rate was 23.30%. Extended to a five-year horizon, this rate increased to 24.70% per year. And over the past decade, Zoetis Inc's annual dividends per share growth rate stands at an impressive 21.60%.
Based on Zoetis Inc's dividend yield and five-year growth rate, the 5-year yield on cost of Zoetis Inc stock as of today is approximately 3.08%.
The Sustainability Question: Payout Ratio and Profitability
To assess the sustainability of the dividend, one needs to evaluate the company's payout ratio. The dividend payout ratio provides insights into the portion of earnings the company distributes as dividends. A lower ratio suggests that the company retains a significant part of its earnings, thereby ensuring the availability of funds for future growth and unexpected downturns. As of 2023-12-31, Zoetis Inc's dividend payout ratio is 0.28.
Zoetis Inc's profitability rank, offers an understanding of the company's earnings prowess relative to its peers. GuruFocus ranks Zoetis Inc's profitability 10 out of 10 as of 2023-12-31, suggesting good profitability prospects. The company has reported positive net income for each of year over the past decade, further solidifying its high profitability.
Growth Metrics: The Future Outlook
To ensure the sustainability of dividends, a company must have robust growth metrics. Zoetis Inc's growth rank of 10 out of 10 suggests that the company's growth trajectory is good relative to its competitors. Revenue is the lifeblood of any company, and Zoetis Inc's revenue per share, combined with the 3-year revenue growth rate, indicates a strong revenue model. Zoetis Inc's revenue has increased by approximately 9.80% per year on average, a rate that outperforms than approximately 60.02% of global competitors.
The company's 3-year EPS growth rate showcases its capability to grow its earnings, a critical component for sustaining dividends in the long run. During the past three years, Zoetis Inc's earnings increased by approximately 11.40% per year on average, a rate that outperforms than approximately 50.3% of global competitors.
Lastly, the company's 5-year EBITDA growth rate of 11.30%, which outperforms than approximately 52.72% of global competitors.
Next Steps
In conclusion, Zoetis Inc's dividend payments, consistent growth rates, manageable payout ratio, and strong profitability and growth metrics paint a positive picture for current and potential investors. The company's performance suggests a reliable dividend income stream with the potential for growth, making it an appealing option for value investors focused on long-term returns. With a robust financial foundation and a promising outlook, Zoetis Inc appears well-positioned to continue rewarding shareholders. Will Zoetis Inc maintain its trajectory and continue to be a dividend achiever in the years to come? This is a key question for investors as they consider the future potential of their investments.
GuruFocus Premium users can screen for high-dividend yield stocks using the High Dividend Yield Screener.
This article, generated by GuruFocus, is designed to provide general insights and is not tailored financial advice. Our commentary is rooted in historical data and analyst projections, utilizing an impartial methodology, and is not intended to serve as specific investment guidance. It does not formulate a recommendation to purchase or divest any stock and does not consider individual investment objectives or financial circumstances. Our objective is to deliver long-term, fundamental data-driven analysis. Be aware that our analysis might not incorporate the most recent, price-sensitive company announcements or qualitative information. GuruFocus holds no position in the stocks mentioned herein.
This article first appeared on GuruFocus.
