
 Yahoo Finance
 Yongmao Holdings (SGX:BKX) Is Experiencing Growth In Returns On Capital
To find a multi-bagger stock, what are the underlying trends we should look for in a business? Firstly, we'd want to identify a growing return on capital employed (ROCE) and then alongside that, an ever-increasing base of capital employed. Basically this means that a company has profitable initiatives that it can continue to reinvest in, which is a trait of a compounding machine. So when we looked at Yongmao Holdings (SGX:BKX) and its trend of ROCE, we really liked what we saw.
Understanding Return On Capital Employed (ROCE)
For those that aren't sure what ROCE is, it measures the amount of pre-tax profits a company can generate from the capital employed in its business. Analysts use this formula to calculate it for Yongmao Holdings:
Return on Capital Employed = Earnings Before Interest and Tax (EBIT) ÷ (Total Assets - Current Liabilities)
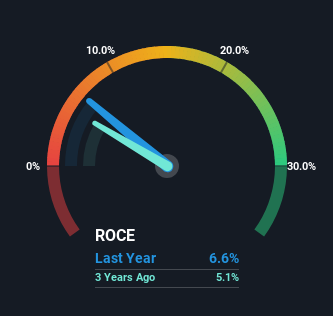
0.066 = CN¥73m ÷ (CN¥2.0b - CN¥909m) (Based on the trailing twelve months to September 2023).
So, Yongmao Holdings has an ROCE of 6.6%. On its own that's a low return on capital but it's in line with the industry's average returns of 6.8%.
See our latest analysis for Yongmao Holdings
While the past is not representative of the future, it can be helpful to know how a company has performed historically, which is why we have this chart above. If you want to delve into the historical earnings, revenue and cash flow of Yongmao Holdings, check out these free graphs here.
What Can We Tell From Yongmao Holdings' ROCE Trend?
Even though ROCE is still low in absolute terms, it's good to see it's heading in the right direction. Over the last five years, returns on capital employed have risen substantially to 6.6%. Basically the business is earning more per dollar of capital invested and in addition to that, 44% more capital is being employed now too. So we're very much inspired by what we're seeing at Yongmao Holdings thanks to its ability to profitably reinvest capital.
On a separate but related note, it's important to know that Yongmao Holdings has a current liabilities to total assets ratio of 45%, which we'd consider pretty high. This effectively means that suppliers (or short-term creditors) are funding a large portion of the business, so just be aware that this can introduce some elements of risk. While it's not necessarily a bad thing, it can be beneficial if this ratio is lower.
In Conclusion...
To sum it up, Yongmao Holdings has proven it can reinvest in the business and generate higher returns on that capital employed, which is terrific. And a remarkable 231% total return over the last five years tells us that investors are expecting more good things to come in the future. With that being said, we still think the promising fundamentals mean the company deserves some further due diligence.
Yongmao Holdings does come with some risks though, we found 3 warning signs in our investment analysis, and 2 of those are potentially serious...
For those who like to invest in solid companies, check out this free list of companies with solid balance sheets and high returns on equity.
Have feedback on this article? Concerned about the content? Get in touch with us directly. Alternatively, email editorial-team (at) simplywallst.com.
This article by Simply Wall St is general in nature. We provide commentary based on historical data and analyst forecasts only using an unbiased methodology and our articles are not intended to be financial advice. It does not constitute a recommendation to buy or sell any stock, and does not take account of your objectives, or your financial situation. We aim to bring you long-term focused analysis driven by fundamental data. Note that our analysis may not factor in the latest price-sensitive company announcements or qualitative material. Simply Wall St has no position in any stocks mentioned.
