
 Yahoo Finance
 Yen: How to Work With the Trend That Barely Bends (JPY)
DailyFX.com -
Talking Points:
- There have been some profound trends developing in the wake of the U.S. Presidential Election, with the Japanese Yen off by -11.5% against both the U.S. Dollar and the Japanese Yen.
- The aggression with which these trends have been priced-in harken back to 2012 when Abe-nomics was first taking the world by storm; and in such a one-sided scenario, trend traders often look to adapt to quicker support/resistance inflections.
- If you’re looking for trading ideas, check out our Trading Guides.
To receive James Stanley’s Analysis directly via email, please sign up here.
After the outsized run of Yen-weakness seen in response to the U.S. Presidential Election, in which the currency has weakened by more than 11.5% against the U.S. Dollar; the trade was due for a bit of a retracement. When new trends are developing, the veracity with which that trend gets priced-in can often exhibit the level of sentiment, or perhaps more accurately in this case, the level of excitement that’s pushing demand higher as price action drives to higher-highs and higher-lows. This is very similar to what was seen in Q4 of 2012 as ‘Abe-nomics’ was taking the world by storm, in which there was very little give-back as this new information was priced-in to the market.
So when USD/JPY set a Doji on Friday, traders had all weekend to look at the chart to imagine how a dive on Monday could bring on an evening star reversal pattern. The bigger question was how long bulls might stand on the sideline to allow the bullish trend to retrace, and the answer to that has been ‘not long.’ After driving lower on Monday, price action in USD/JPY ran into a long-term Fibonacci level at 111.618, which is the 50% Fibonacci retracement of the 18-year move in the pair (taking high in 1998, low of 2011). Perhaps more importantly to near-term price action, this same level had helped to set the lows in the pair in February and March of this year, and after prices ran into this support level last night, traders have come-back to selling the Yen (buying USD/JPY) with aggression.
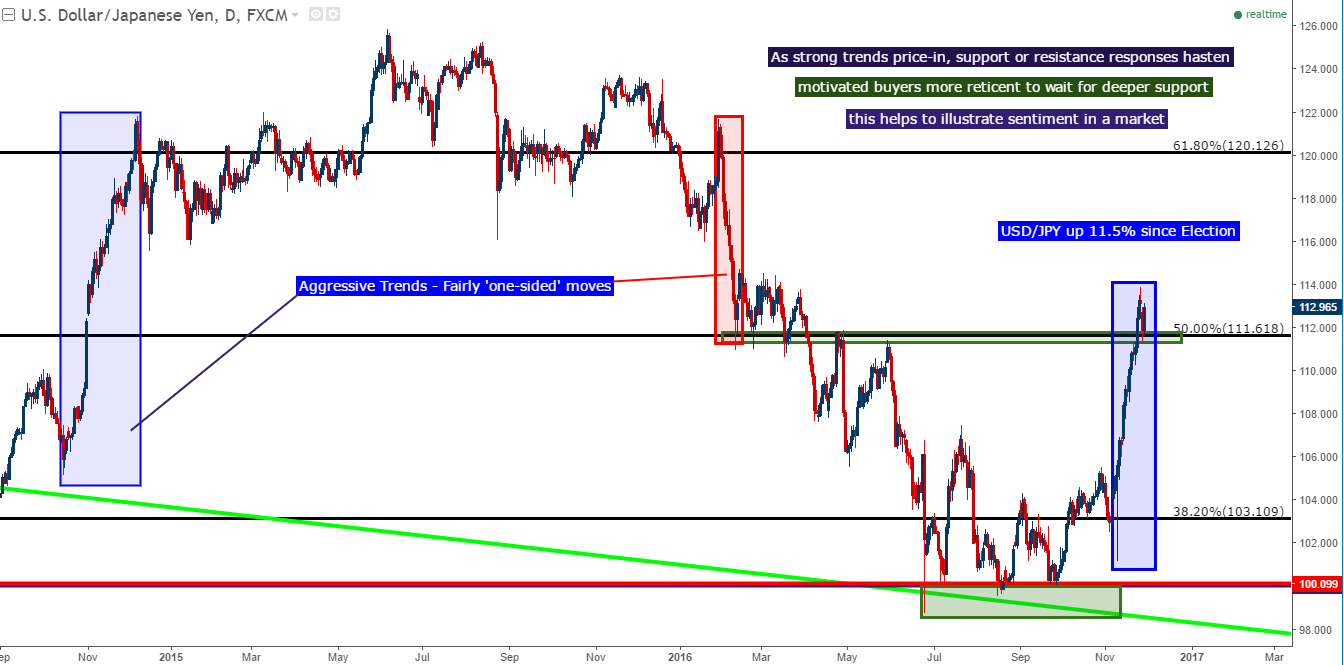
Chart prepared by James Stanley
These types of new trends, while really attractive, can be hard to work with given that traders need to adapt to quicker responses to support and resistance. In a market in which buyers (or sellers) are so motivated that they don’t want to wait for a deeper support (in the case of long positions) or resistance inflections (in the case of shorts), traders either need to move more quickly on the entry or run the risk of missing out on the position (which is probably the preferable of the two, because opportunities continue to show up while capital doesn’t just grow back on its own).
One way that traders can use price action to try to adapt to such an environment is by utilizing faster time frames for entry analysis. The Daily chart we looked at above is quite attractive on USD/JPY, but does little to help plot near-term entries. On the chart below, we’re looking at the one-hour variety of the same setup in USD/JPY in the effort of plotting near-term entry. A major support level at 112.50 is highlighted, as this has been prior price action support as well as being a major psychological level.

Chart prepared by James Stanley
In a similar, albeit more pronounced manner we can pair up the Japanese Yen with the British Pound. While the Greenback has been strong in the wake of U.S. Presidential Elections, so has the Sterling, even if it is for far different reasons. We’ve been discussing this theme for the past couple of months as its becoming more and more likely that the Bank of England is going to have to deal with higher-than-desired inflation in the coming months/years, and this can push the bank’s hand away from additional stimulus actions and rate cuts. And for a currency like the British Pound that was absolutely beaten down by a combination of Brexit risks and overtly-dovish monetary policy from the BoE; there are probably still a lot of large short positions out there that need to cover, and this could lead to even more top-side as markets price-in a lower probability of additional rate cuts.
To gauge this impact and compare performance in GBP against the U.S. Dollar, we can refer to the Cable chart to notice that, since U.S. Presidential Elections, GBP/USD has been largely range-bound, and sticking to the levels furnished by the Fibonacci retracement drawn around post-Brexit price action. If you’d like to read more about the setup, please check out our article from last week entitled, GBP/USD: Bullish Despite USD’s 13-Year Highs.
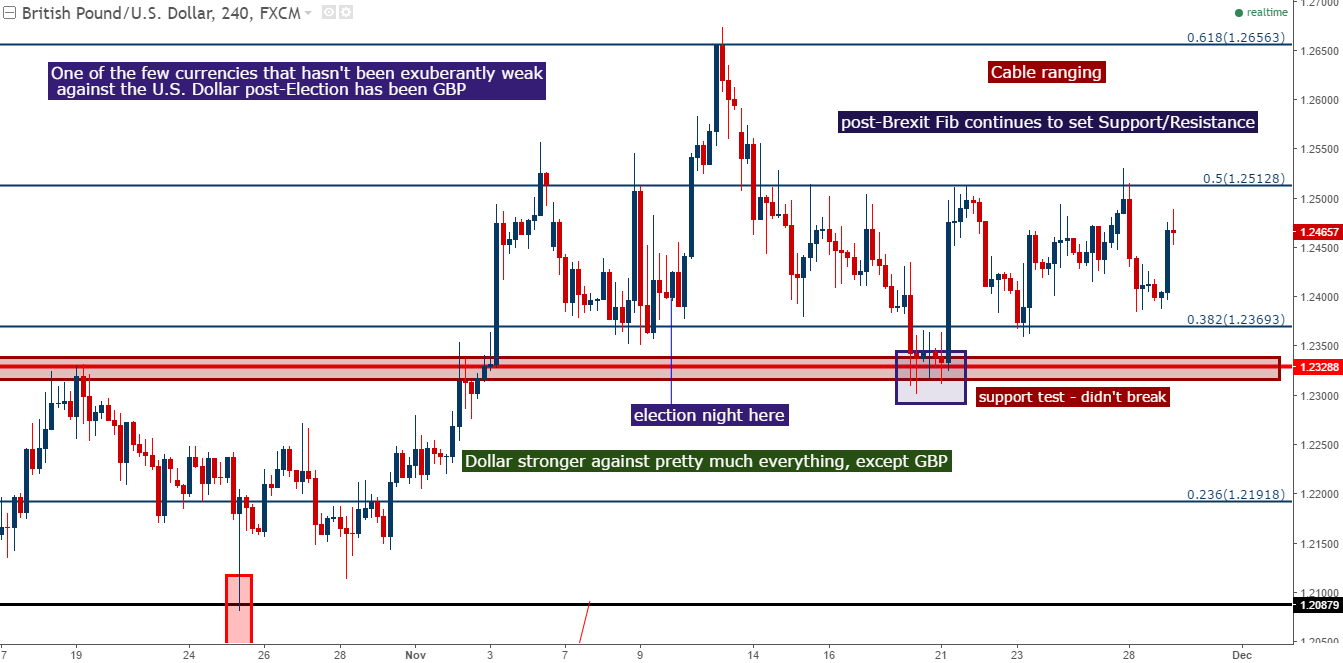
Chart prepared by James Stanley
If we apply this GBP-strength seen after the U.S. Presidential Election to the Japanese Yen, we’ll see another aggressive top-side move similar to what we’ve seen in USD/JPY. GBP/JPY is also up 11.5% from the lows of election night, but on the shorter-term charts, the bullish move has seen even less retracement as traders have more aggressively defended support. Last night produced a support hit to the level we’ve been watching for re-entry at 138.83, as we outlined in our most recent GBP/JPY Technical Analysis piece entitled, Bullish and Bursting to 4-Month Highs.
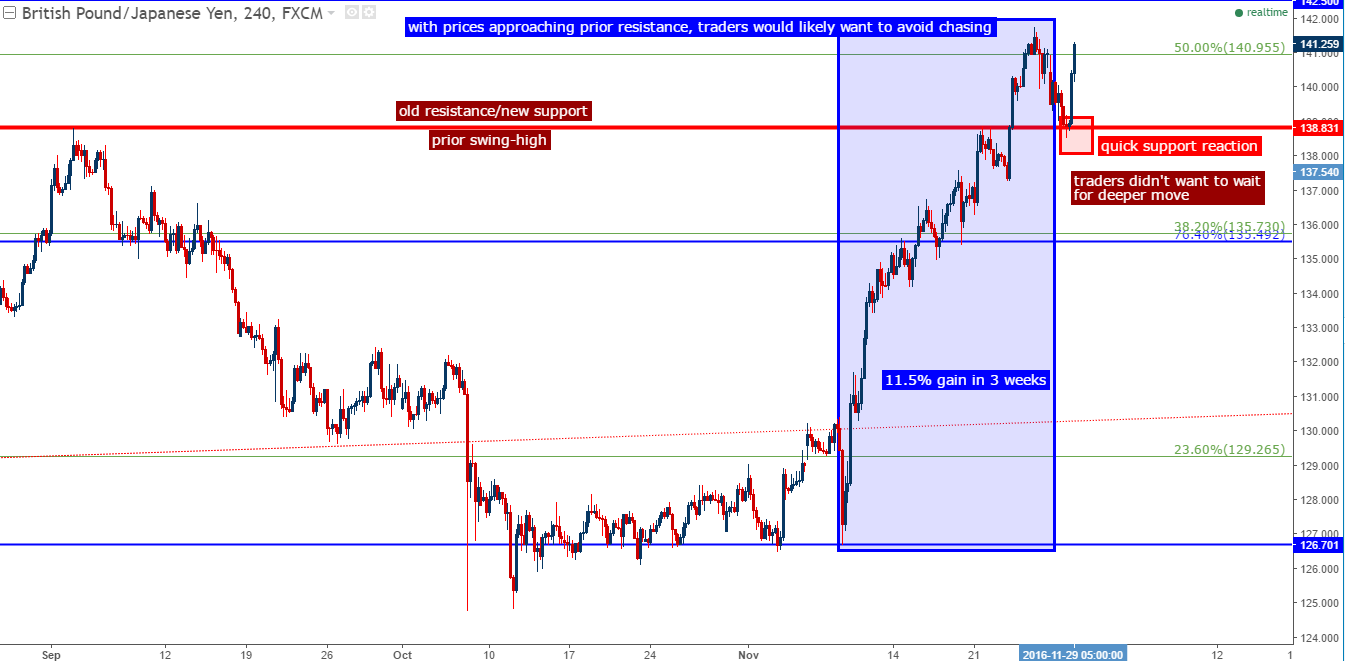
Chart prepared by James Stanley
On the below chart, we’ve zoomed in a bit quicker to look at the hourly setup in GBP/JPY. Notice the aggression with which last night’s support inflection has led-in to another bullish burst higher that gave very little resistance at a couple of key levels. At 140.96 we have a long-term Fibonacci level that had previously helped to set resistance to end last week; and a bit deeper at 140.00 we have a major psychological level that could offer a ‘less aggressive’ re-entry arrangement for traders looking to trade the top-side move should support show up there.
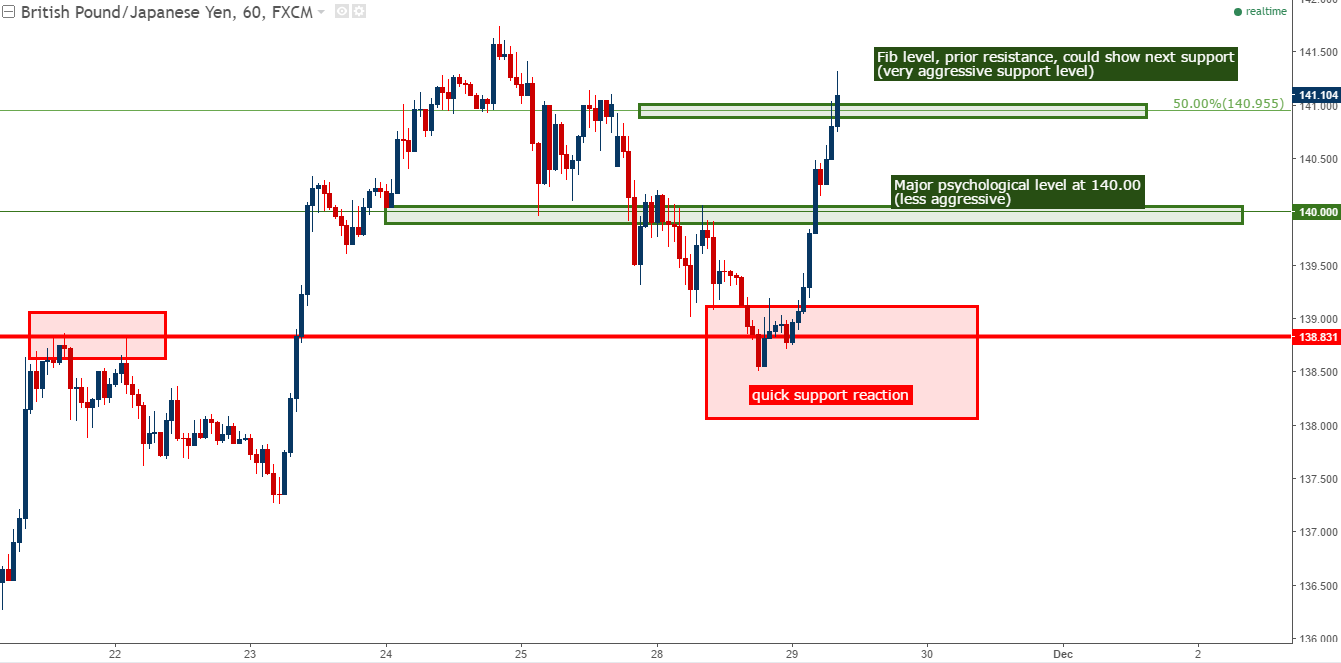
Chart prepared by James Stanley
--- Written by James Stanley, Analyst for DailyFX.com
To receive James Stanley’s analysis directly via email, please SIGN UP HERE
Contact and follow James on Twitter: @JStanleyFX
DailyFX provides forex news and technical analysis on the trends that influence the global currency markets.
Learn forex trading with a free practice account and trading charts from IG.
