
 Yahoo Finance
 Y&G Corporation Bhd (KLSE:Y&G) Might Be Having Difficulty Using Its Capital Effectively
To find a multi-bagger stock, what are the underlying trends we should look for in a business? In a perfect world, we'd like to see a company investing more capital into its business and ideally the returns earned from that capital are also increasing. Ultimately, this demonstrates that it's a business that is reinvesting profits at increasing rates of return. However, after investigating Y&G Corporation Bhd (KLSE:Y&G), we don't think it's current trends fit the mold of a multi-bagger.
What Is Return On Capital Employed (ROCE)?
If you haven't worked with ROCE before, it measures the 'return' (pre-tax profit) a company generates from capital employed in its business. To calculate this metric for Y&G Corporation Bhd, this is the formula:
Return on Capital Employed = Earnings Before Interest and Tax (EBIT) ÷ (Total Assets - Current Liabilities)
0.023 = RM8.8m ÷ (RM400m - RM25m) (Based on the trailing twelve months to September 2023).
So, Y&G Corporation Bhd has an ROCE of 2.3%. In absolute terms, that's a low return and it also under-performs the Construction industry average of 6.4%.
Check out our latest analysis for Y&G Corporation Bhd
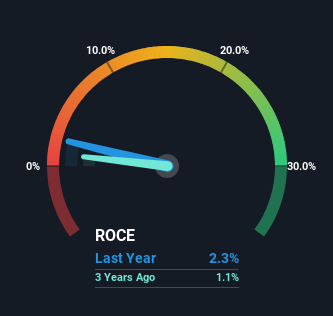
Historical performance is a great place to start when researching a stock so above you can see the gauge for Y&G Corporation Bhd's ROCE against it's prior returns. If you're interested in investigating Y&G Corporation Bhd's past further, check out this free graph of past earnings, revenue and cash flow.
What The Trend Of ROCE Can Tell Us
When we looked at the ROCE trend at Y&G Corporation Bhd, we didn't gain much confidence. Around five years ago the returns on capital were 5.4%, but since then they've fallen to 2.3%. And considering revenue has dropped while employing more capital, we'd be cautious. If this were to continue, you might be looking at a company that is trying to reinvest for growth but is actually losing market share since sales haven't increased.
In Conclusion...
In summary, we're somewhat concerned by Y&G Corporation Bhd's diminishing returns on increasing amounts of capital. Long term shareholders who've owned the stock over the last five years have experienced a 24% depreciation in their investment, so it appears the market might not like these trends either. That being the case, unless the underlying trends revert to a more positive trajectory, we'd consider looking elsewhere.
One more thing, we've spotted 1 warning sign facing Y&G Corporation Bhd that you might find interesting.
While Y&G Corporation Bhd may not currently earn the highest returns, we've compiled a list of companies that currently earn more than 25% return on equity. Check out this free list here.
Have feedback on this article? Concerned about the content? Get in touch with us directly. Alternatively, email editorial-team (at) simplywallst.com.
This article by Simply Wall St is general in nature. We provide commentary based on historical data and analyst forecasts only using an unbiased methodology and our articles are not intended to be financial advice. It does not constitute a recommendation to buy or sell any stock, and does not take account of your objectives, or your financial situation. We aim to bring you long-term focused analysis driven by fundamental data. Note that our analysis may not factor in the latest price-sensitive company announcements or qualitative material. Simply Wall St has no position in any stocks mentioned.
