
 Yahoo Finance
 XPO (NYSE:XPO) shareholders have earned a 115% return over the last year
XPO, Inc. (NYSE:XPO) shareholders might be concerned after seeing the share price drop 12% in the last quarter. Despite this, the stock is a strong performer over the last year, no doubt about that. Indeed, the share price is up an impressive 115% in that time. So it is important to view the recent reduction in price through that lense. Investors should be wondering whether the business itself has the fundamental value required to continue to drive gains.
With that in mind, it's worth seeing if the company's underlying fundamentals have been the driver of long term performance, or if there are some discrepancies.
View our latest analysis for XPO
While markets are a powerful pricing mechanism, share prices reflect investor sentiment, not just underlying business performance. One flawed but reasonable way to assess how sentiment around a company has changed is to compare the earnings per share (EPS) with the share price.
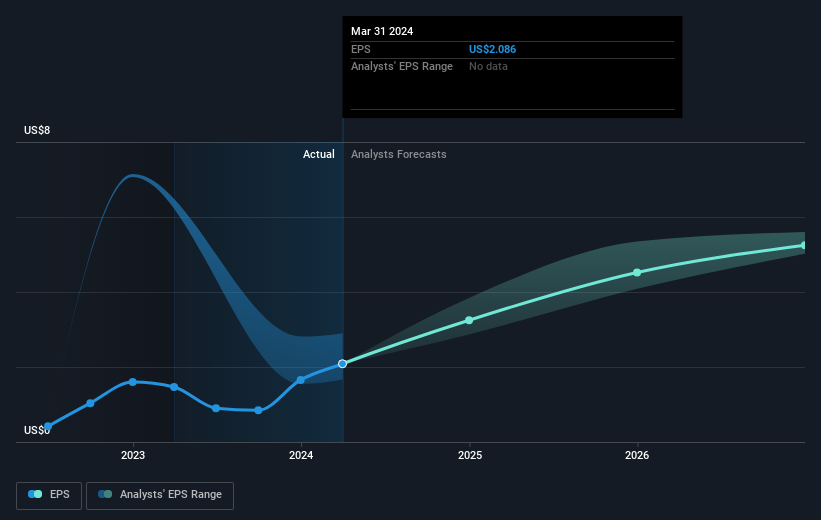
During the last year XPO grew its earnings per share (EPS) by 42%. The share price gain of 115% certainly outpaced the EPS growth. So it's fair to assume the market has a higher opinion of the business than it a year ago. The fairly generous P/E ratio of 51.13 also points to this optimism.
The company's earnings per share (over time) is depicted in the image below (click to see the exact numbers).
We consider it positive that insiders have made significant purchases in the last year. Having said that, most people consider earnings and revenue growth trends to be a more meaningful guide to the business. Before buying or selling a stock, we always recommend a close examination of historic growth trends, available here..
A Different Perspective
It's nice to see that XPO shareholders have received a total shareholder return of 115% over the last year. That gain is better than the annual TSR over five years, which is 42%. Therefore it seems like sentiment around the company has been positive lately. Someone with an optimistic perspective could view the recent improvement in TSR as indicating that the business itself is getting better with time. While it is well worth considering the different impacts that market conditions can have on the share price, there are other factors that are even more important. Take risks, for example - XPO has 2 warning signs (and 1 which doesn't sit too well with us) we think you should know about.
XPO is not the only stock insiders are buying. So take a peek at this free list of small cap companies at attractive valuations which insiders have been buying.
Please note, the market returns quoted in this article reflect the market weighted average returns of stocks that currently trade on American exchanges.
Have feedback on this article? Concerned about the content? Get in touch with us directly. Alternatively, email editorial-team (at) simplywallst.com.
This article by Simply Wall St is general in nature. We provide commentary based on historical data and analyst forecasts only using an unbiased methodology and our articles are not intended to be financial advice. It does not constitute a recommendation to buy or sell any stock, and does not take account of your objectives, or your financial situation. We aim to bring you long-term focused analysis driven by fundamental data. Note that our analysis may not factor in the latest price-sensitive company announcements or qualitative material. Simply Wall St has no position in any stocks mentioned.
