
 Yahoo Finance
 WTI Crude Oil Price Forecast: Daily Support and Resistance Levels
DailyFX.com -
Talking Points
Crude Oil Prices Find Short Term Support at $46.41
Bullish Crude Oil Breakouts Begin Over $47.47
If you are looking for Crude Oil trading Ideas, check out our Trading Guides.
The price of WTI Crude Oil (CFD:USOil), has opened lower and is trading to new weekly lows . Currently the pair is testing short term support near $46.41. This area is depicted below as the S3 Camarilla pivot. The next value of support for Crude Oil is found at $46.05. If prices fall below this value, it would suggest that Crude Oil may continue to breakout towards new lower lows. In this continued bearish scenario, traders may extrapolate 1X today’s trading range, and find initial bearish targets near $45.34.
Traders watching for a bullish reversal in today’s trading should continue to monitor the S3 pivot for a bounce in price at support. If Crude Oil prices stay above this value, it opens the commodity up to trade back towards values of resistance. This includes the R3 and R4 resistance values, found at $47.12 and $47.47 respectfully. It should be noted hear that Bullish breakouts for the session may begin over R4 pivot at $47.47. A move to this price should be considered significant as it would be the first attempted bullish breakout for Crude this week.
Losing Money Trading? This could be why!
WTI Crude Oil (USOil), 30 Minute Chart with Pivots
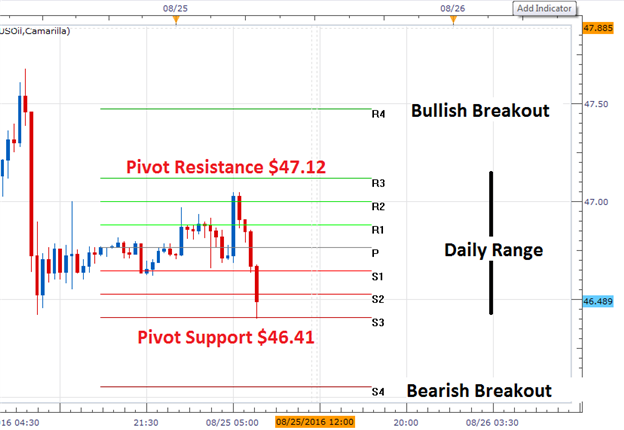
(Created using Marketscope 2.0 Charts)
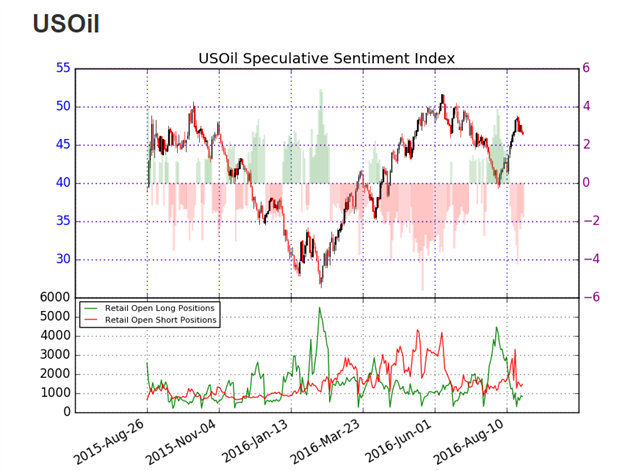
The ratio of long to short positions for Crude Oil (Ticker:USOil) stands at -1.76. This SSI (speculative sentiment index) reading indicates that 65% of positioning is currently short. Typically, when read as a contrarian signal, this suggests that the price of Crude Oil may continue to advance. In the event of a continued bearish move, traders should alternatively look for SSI to potentially shift back towards more neutral values.
Are FXCM traders long or short the market Find out here!
To Receive Walkers’ analysis directly via email, please SIGN UP HERE
See Walker’s most recent articles at his Bio Page.
Do you know the biggest mistake traders make? More importantly, do you know how to overcome the biggest mistake? Read page 8 of the Traits of Successful Traders Guide to find out [free registration required].
Contact and Follow Walker on Twitter @WEnglandFX.
DailyFX provides forex news and technical analysis on the trends that influence the global currency markets.
Learn forex trading with a free practice account and trading charts from FXCM.
