
 Yahoo Finance
 Winnebago (WGO) Q1 Earnings Beat on Marine Unit Strength
Winnebago WGO reported adjusted earnings of $2.07 per share in first-quarter fiscal 2023 (ended Nov 26, 2022), which topped the Zacks Consensus Estimate of $1.83 on share higher-than-anticipated revenues and EBITDA from the Marine segment. The bottom line, however, plunged 41% year over year. The recreational vehicle (RV) maker reported revenues of $952.2 million in the quarter under review, crossing the Zacks Consensus Estimate of $899 million. Nonetheless, the top line fell 17.6% year over year.
Winnebago Industries, Inc. Price, Consensus and EPS Surprise
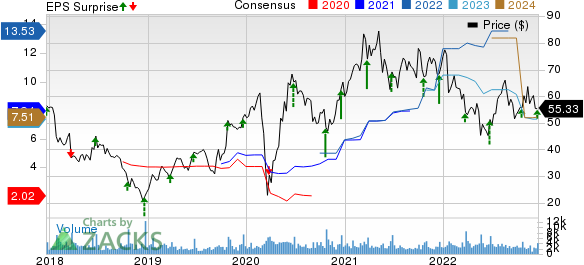
Winnebago Industries, Inc. price-consensus-eps-surprise-chart | Winnebago Industries, Inc. Quote
Segmental Performance
Revenues in the Towable segment in the reported quarter fell 46.7% year over year to $347.3 million, primarily led by a decline in unit volume. The total deliveries from the segment came at 7,191 units, decreasing 56.2% year over year and missing the consensus metric of 9,378 units. Quarterly adjusted EBITDA declined 67.6% to $36.3 million, reflecting higher material and component costs and deleverage. The figure missed the consensus mark of $57 million. The segment’s backlog was $434 million (10,441 units), decreasing 76.9%.
In the reported quarter, revenues in the Motorhome segment improved 10.1% year over year to $464.2 million on strong pricing actions. The total deliveries from the segment came at 2,508 units, down 8.3% year over year and missing the consensus metric of 2,973 units. The segment recorded an EBITDA of $50 million, edging up 0.2% but lagged the consensus mark of $56 million. The backlog was $1,596 million (10,089 units), down 33.8% from the prior year.
In the reported quarter, revenues in the Marine segment were $131.4 million, jumping 65.7% year over year, largely driven by the Barletta buyout. The metric also topped the consensus mark of $106 million. The total deliveries from the segment came at 1,700 units, up 49.8% year over year and surpassing the consensus metric of 1,423 units. The segment recorded an EBITDA of $18.5 million, shooting up 74.5% year over year and exceeding the consensus metric of $15.26 million. The backlog for the Marine segment was $318.5 million (3,633 units), soaring 23.8%.
Financials
Winnebago had cash and cash equivalents of $203 million as of Nov 26, 2022. The long-term debt (excluding current maturities) increased to $590.4 million from $545.9 million recorded on Aug 27, 2022. The company approved a dividend of 27 cents a share, to be paid on Jan 25, 2023, to shareholders of record at the close of business on Jan 11, 2023.
WGO currently carries a Zacks Rank #4 (Sell.).
You can see the complete list of today’s Zacks Rank #1 (Strong) stocks here.
What Did Thor’s Latest Quarterly Report Unveil?
Winnebago’s closest peer Thor Industries THO delivered mixed first-quarter fiscal 2023 (ended Oct 31, 2022) results. Adjusted earnings of $2.53 per share surpassed the Zacks Consensus Estimate of $2.09. This marked the 11th straight earnings beat for Thor. The bottom line, however, declined from the year-ago profit of $4.34 per share. The company registered revenues of $3,108.1 million in the quarter under review, missing the Zacks Consensus Estimate of $3,117 million. The top line also fell 21.5% year over year.
Thor expects fiscal 2023 net sales in the band of $11.5-$12.5 billion, implying a decline from $16.31 billion recorded in fiscal 2022. The gross profit margin is expected in the range of 14.2-14.9%. Earnings per share are envisioned to be between $7.40 and $8.70, suggesting a sharp contraction from $20.59 in fiscal 2022.
Want the latest recommendations from Zacks Investment Research? Today, you can download 7 Best Stocks for the Next 30 Days. Click to get this free report
Thor Industries, Inc. (THO) : Free Stock Analysis Report
Winnebago Industries, Inc. (WGO) : Free Stock Analysis Report
