
 Yahoo Finance
 Willdan Group (NASDAQ:WLDN) Is Looking To Continue Growing Its Returns On Capital
If we want to find a stock that could multiply over the long term, what are the underlying trends we should look for? Typically, we'll want to notice a trend of growing return on capital employed (ROCE) and alongside that, an expanding base of capital employed. Basically this means that a company has profitable initiatives that it can continue to reinvest in, which is a trait of a compounding machine. So on that note, Willdan Group (NASDAQ:WLDN) looks quite promising in regards to its trends of return on capital.
Return On Capital Employed (ROCE): What Is It?
For those that aren't sure what ROCE is, it measures the amount of pre-tax profits a company can generate from the capital employed in its business. The formula for this calculation on Willdan Group is:
Return on Capital Employed = Earnings Before Interest and Tax (EBIT) ÷ (Total Assets - Current Liabilities)
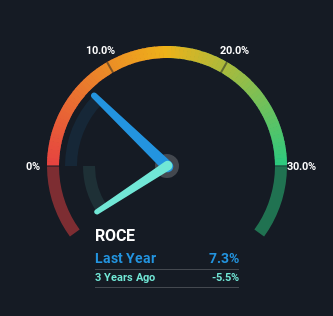
0.073 = US$22m ÷ (US$416m - US$115m) (Based on the trailing twelve months to December 2023).
Thus, Willdan Group has an ROCE of 7.3%. In absolute terms, that's a low return and it also under-performs the Professional Services industry average of 13%.
View our latest analysis for Willdan Group
In the above chart we have measured Willdan Group's prior ROCE against its prior performance, but the future is arguably more important. If you'd like to see what analysts are forecasting going forward, you should check out our free analyst report for Willdan Group .
The Trend Of ROCE
Even though ROCE is still low in absolute terms, it's good to see it's heading in the right direction. Over the last five years, returns on capital employed have risen substantially to 7.3%. The amount of capital employed has increased too, by 43%. This can indicate that there's plenty of opportunities to invest capital internally and at ever higher rates, a combination that's common among multi-baggers.
The Key Takeaway
To sum it up, Willdan Group has proven it can reinvest in the business and generate higher returns on that capital employed, which is terrific. Astute investors may have an opportunity here because the stock has declined 31% in the last five years. So researching this company further and determining whether or not these trends will continue seems justified.
If you'd like to know about the risks facing Willdan Group, we've discovered 1 warning sign that you should be aware of.
For those who like to invest in solid companies, check out this free list of companies with solid balance sheets and high returns on equity.
Have feedback on this article? Concerned about the content? Get in touch with us directly. Alternatively, email editorial-team (at) simplywallst.com.
This article by Simply Wall St is general in nature. We provide commentary based on historical data and analyst forecasts only using an unbiased methodology and our articles are not intended to be financial advice. It does not constitute a recommendation to buy or sell any stock, and does not take account of your objectives, or your financial situation. We aim to bring you long-term focused analysis driven by fundamental data. Note that our analysis may not factor in the latest price-sensitive company announcements or qualitative material. Simply Wall St has no position in any stocks mentioned.
