
 Yahoo Finance
 Why We Like The Returns At James Hardie Industries (ASX:JHX)
To find a multi-bagger stock, what are the underlying trends we should look for in a business? Amongst other things, we'll want to see two things; firstly, a growing return on capital employed (ROCE) and secondly, an expansion in the company's amount of capital employed. Basically this means that a company has profitable initiatives that it can continue to reinvest in, which is a trait of a compounding machine. Speaking of which, we noticed some great changes in James Hardie Industries' (ASX:JHX) returns on capital, so let's have a look.
Return On Capital Employed (ROCE): What Is It?
Just to clarify if you're unsure, ROCE is a metric for evaluating how much pre-tax income (in percentage terms) a company earns on the capital invested in its business. To calculate this metric for James Hardie Industries, this is the formula:
Return on Capital Employed = Earnings Before Interest and Tax (EBIT) ÷ (Total Assets - Current Liabilities)
0.22 = US$894m ÷ (US$4.8b - US$749m) (Based on the trailing twelve months to December 2023).
So, James Hardie Industries has an ROCE of 22%. In absolute terms that's a great return and it's even better than the Basic Materials industry average of 9.4%.
View our latest analysis for James Hardie Industries
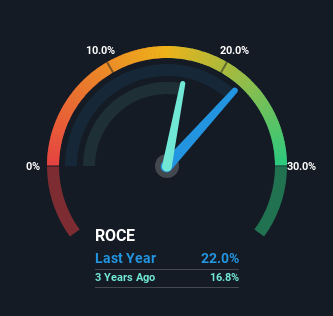
Above you can see how the current ROCE for James Hardie Industries compares to its prior returns on capital, but there's only so much you can tell from the past. If you'd like, you can check out the forecasts from the analysts covering James Hardie Industries for free.
What Does the ROCE Trend For James Hardie Industries Tell Us?
James Hardie Industries' ROCE growth is quite impressive. The figures show that over the last five years, ROCE has grown 87% whilst employing roughly the same amount of capital. So it's likely that the business is now reaping the full benefits of its past investments, since the capital employed hasn't changed considerably. On that front, things are looking good so it's worth exploring what management has said about growth plans going forward.
The Bottom Line
To sum it up, James Hardie Industries is collecting higher returns from the same amount of capital, and that's impressive. And with the stock having performed exceptionally well over the last five years, these patterns are being accounted for by investors. In light of that, we think it's worth looking further into this stock because if James Hardie Industries can keep these trends up, it could have a bright future ahead.
While James Hardie Industries looks impressive, no company is worth an infinite price. The intrinsic value infographic for JHX helps visualize whether it is currently trading for a fair price.
High returns are a key ingredient to strong performance, so check out our free list ofstocks earning high returns on equity with solid balance sheets.
Have feedback on this article? Concerned about the content? Get in touch with us directly. Alternatively, email editorial-team (at) simplywallst.com.
This article by Simply Wall St is general in nature. We provide commentary based on historical data and analyst forecasts only using an unbiased methodology and our articles are not intended to be financial advice. It does not constitute a recommendation to buy or sell any stock, and does not take account of your objectives, or your financial situation. We aim to bring you long-term focused analysis driven by fundamental data. Note that our analysis may not factor in the latest price-sensitive company announcements or qualitative material. Simply Wall St has no position in any stocks mentioned.
