
 Yahoo Finance
 Why We Like The Returns At AirAsia X Berhad (KLSE:AAX)
If we want to find a stock that could multiply over the long term, what are the underlying trends we should look for? Firstly, we'd want to identify a growing return on capital employed (ROCE) and then alongside that, an ever-increasing base of capital employed. Put simply, these types of businesses are compounding machines, meaning they are continually reinvesting their earnings at ever-higher rates of return. Speaking of which, we noticed some great changes in AirAsia X Berhad's (KLSE:AAX) returns on capital, so let's have a look.
What Is Return On Capital Employed (ROCE)?
For those who don't know, ROCE is a measure of a company's yearly pre-tax profit (its return), relative to the capital employed in the business. To calculate this metric for AirAsia X Berhad, this is the formula:
Return on Capital Employed = Earnings Before Interest and Tax (EBIT) ÷ (Total Assets - Current Liabilities)
0.22 = RM484m ÷ (RM3.1b - RM898m) (Based on the trailing twelve months to December 2023).
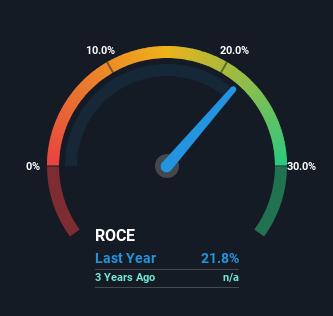
Therefore, AirAsia X Berhad has an ROCE of 22%. In absolute terms that's a great return and it's even better than the Airlines industry average of 9.2%.
See our latest analysis for AirAsia X Berhad
In the above chart we have measured AirAsia X Berhad's prior ROCE against its prior performance, but the future is arguably more important. If you'd like to see what analysts are forecasting going forward, you should check out our free analyst report for AirAsia X Berhad .
So How Is AirAsia X Berhad's ROCE Trending?
Shareholders will be relieved that AirAsia X Berhad has broken into profitability. While the business was unprofitable in the past, it's now turned things around and is earning 22% on its capital. On top of that, what's interesting is that the amount of capital being employed has remained steady, so the business hasn't needed to put any additional money to work to generate these higher returns. So while we're happy that the business is more efficient, just keep in mind that could mean that going forward the business is lacking areas to invest internally for growth. Because in the end, a business can only get so efficient.
One more thing to note, AirAsia X Berhad has decreased current liabilities to 29% of total assets over this period, which effectively reduces the amount of funding from suppliers or short-term creditors. So shareholders would be pleased that the growth in returns has mostly come from underlying business performance.
In Conclusion...
To bring it all together, AirAsia X Berhad has done well to increase the returns it's generating from its capital employed. Given the stock has declined 45% in the last five years, this could be a good investment if the valuation and other metrics are also appealing. With that in mind, we believe the promising trends warrant this stock for further investigation.
One more thing: We've identified 3 warning signs with AirAsia X Berhad (at least 1 which doesn't sit too well with us) , and understanding them would certainly be useful.
If you'd like to see other companies earning high returns, check out our free list of companies earning high returns with solid balance sheets here.
Have feedback on this article? Concerned about the content? Get in touch with us directly. Alternatively, email editorial-team (at) simplywallst.com.
This article by Simply Wall St is general in nature. We provide commentary based on historical data and analyst forecasts only using an unbiased methodology and our articles are not intended to be financial advice. It does not constitute a recommendation to buy or sell any stock, and does not take account of your objectives, or your financial situation. We aim to bring you long-term focused analysis driven by fundamental data. Note that our analysis may not factor in the latest price-sensitive company announcements or qualitative material. Simply Wall St has no position in any stocks mentioned.
