
 Yahoo Finance
 Why Haw Par Corporation Limited (SGX:H02) Is A Financially Healthy Company

Mid-caps stocks, like Haw Par Corporation Limited (SGX:H02) with a market capitalization of S$3.00B, aren’t the focus of most investors who prefer to direct their investments towards either large-cap or small-cap stocks. However, history shows that overlooked mid-cap companies have performed better on a risk-adjusted manner than the smaller and larger segment of the market. H02’s financial liquidity and debt position will be analysed in this article, to get an idea of whether the company can fund opportunities for strategic growth and maintain strength through economic downturns. Don’t forget that this is a general and concentrated examination of Amazon’s financial health, so you should conduct further analysis into H02 here. View our latest analysis for Haw Par
Does H02 generate enough cash through operations?
H02’s debt level has been constant at around S$45.05M over the previous year , which is mainly comprised of near term debt. At this current level of debt, H02’s cash and short-term investments stands at S$921.01M for investing into the business. Moreover, H02 has produced S$106.83M in operating cash flow during the same period of time, leading to an operating cash to total debt ratio of 237.15%, meaning that H02’s operating cash is sufficient to cover its debt. This ratio can also be a sign of operational efficiency as an alternative to return on assets. In H02’s case, it is able to generate 2.37x cash from its debt capital.
Can H02 pay its short-term liabilities?
Looking at H02’s most recent S$114.95M liabilities, it seems that the business has been able to meet these commitments with a current assets level of S$970.24M, leading to a 8.44x current account ratio. Though, anything above 3x is considered high and could mean that H02 has too much idle capital in low-earning investments.
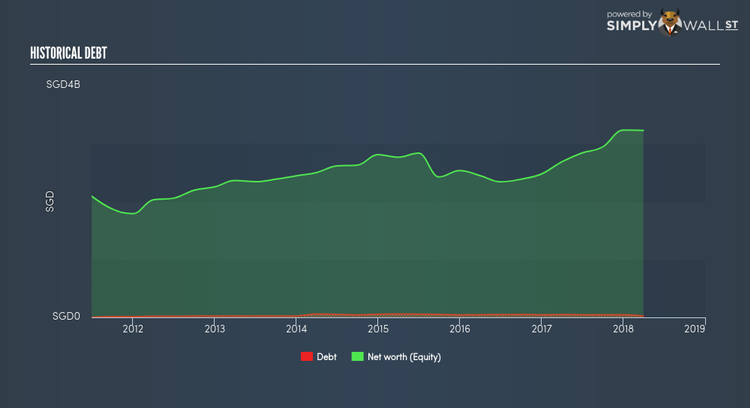
Is H02’s debt level acceptable?
What is considered a high debt-to-equity ratio differs depending on the industry, because some industries tend to utilize more debt financing than others. A ratio below 40% for mid-cap stocks is considered as financially healthy, as a rule of thumb. The good news for investors is that Haw Par has virtually no debt. It has been operating its business with miniscule debt and utilising only its equity capital. Investors’ risk associated with debt is virtually non-existent with H02, and the company has plenty of headroom and ability to raise debt should it need to in the future.
Next Steps:
H02 has demonstrated its ability to generate sufficient levels of cash flow, while its debt hovers at a safe level. In addition to this, the company will be able to pay all of its upcoming liabilities from its current short-term assets. This is only a rough assessment of financial health, and I’m sure H02 has company-specific issues impacting its capital structure decisions. I suggest you continue to research Haw Par to get a better picture of the stock by looking at:
Valuation: What is H02 worth today? Is the stock undervalued, even when its growth outlook is factored into its intrinsic value? The intrinsic value infographic in our free research report helps visualize whether H02 is currently mispriced by the market.
Historical Performance: What has H02’s returns been like over the past? Go into more detail in the past track record analysis and take a look at the free visual representations of our analysis for more clarity.
Other High-Performing Stocks: Are there other stocks that provide better prospects with proven track records? Explore our free list of these great stocks here.
To help readers see pass the short term volatility of the financial market, we aim to bring you a long-term focused research analysis purely driven by fundamental data. Note that our analysis does not factor in the latest price sensitive company announcements.
The author is an independent contributor and at the time of publication had no position in the stocks mentioned.
