
 Yahoo Finance
 Why The 21% Return On Capital At XMH Holdings (SGX:BQF) Should Have Your Attention
Did you know there are some financial metrics that can provide clues of a potential multi-bagger? Ideally, a business will show two trends; firstly a growing return on capital employed (ROCE) and secondly, an increasing amount of capital employed. This shows us that it's a compounding machine, able to continually reinvest its earnings back into the business and generate higher returns. Speaking of which, we noticed some great changes in XMH Holdings' (SGX:BQF) returns on capital, so let's have a look.
Understanding Return On Capital Employed (ROCE)
For those who don't know, ROCE is a measure of a company's yearly pre-tax profit (its return), relative to the capital employed in the business. The formula for this calculation on XMH Holdings is:
Return on Capital Employed = Earnings Before Interest and Tax (EBIT) ÷ (Total Assets - Current Liabilities)
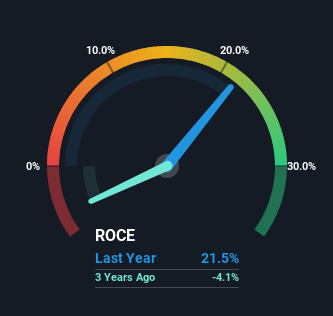
0.21 = S$17m ÷ (S$149m - S$70m) (Based on the trailing twelve months to October 2023).
So, XMH Holdings has an ROCE of 21%. That's a fantastic return and not only that, it outpaces the average of 8.7% earned by companies in a similar industry.
Check out our latest analysis for XMH Holdings
While the past is not representative of the future, it can be helpful to know how a company has performed historically, which is why we have this chart above. If you'd like to look at how XMH Holdings has performed in the past in other metrics, you can view this free graph of XMH Holdings' past earnings, revenue and cash flow.
So How Is XMH Holdings' ROCE Trending?
We're delighted to see that XMH Holdings is reaping rewards from its investments and has now broken into profitability. The company was generating losses five years ago, but now it's turned around, earning 21% which is no doubt a relief for some early shareholders. Additionally, the business is utilizing 25% less capital than it was five years ago, and taken at face value, that can mean the company needs less funds at work to get a return. This could potentially mean that the company is selling some of its assets.
On a side note, we noticed that the improvement in ROCE appears to be partly fueled by an increase in current liabilities. Effectively this means that suppliers or short-term creditors are now funding 47% of the business, which is more than it was five years ago. And with current liabilities at those levels, that's pretty high.
What We Can Learn From XMH Holdings' ROCE
From what we've seen above, XMH Holdings has managed to increase it's returns on capital all the while reducing it's capital base. And a remarkable 118% total return over the last five years tells us that investors are expecting more good things to come in the future. With that being said, we still think the promising fundamentals mean the company deserves some further due diligence.
One final note, you should learn about the 3 warning signs we've spotted with XMH Holdings (including 1 which is a bit concerning) .
If you want to search for more stocks that have been earning high returns, check out this free list of stocks with solid balance sheets that are also earning high returns on equity.
Have feedback on this article? Concerned about the content? Get in touch with us directly. Alternatively, email editorial-team (at) simplywallst.com.
This article by Simply Wall St is general in nature. We provide commentary based on historical data and analyst forecasts only using an unbiased methodology and our articles are not intended to be financial advice. It does not constitute a recommendation to buy or sell any stock, and does not take account of your objectives, or your financial situation. We aim to bring you long-term focused analysis driven by fundamental data. Note that our analysis may not factor in the latest price-sensitive company announcements or qualitative material. Simply Wall St has no position in any stocks mentioned.
