
 Yahoo Finance
 Whitecap Resources Full Year 2023 Earnings: Beats Expectations
Whitecap Resources (TSE:WCP) Full Year 2023 Results
Key Financial Results
Revenue: CA$3.38b (down 14% from FY 2022).
Net income: CA$889.0m (down 47% from FY 2022).
Profit margin: 26% (down from 43% in FY 2022). The decrease in margin was primarily driven by lower revenue.
EPS: CA$1.47 (down from CA$2.72 in FY 2022).
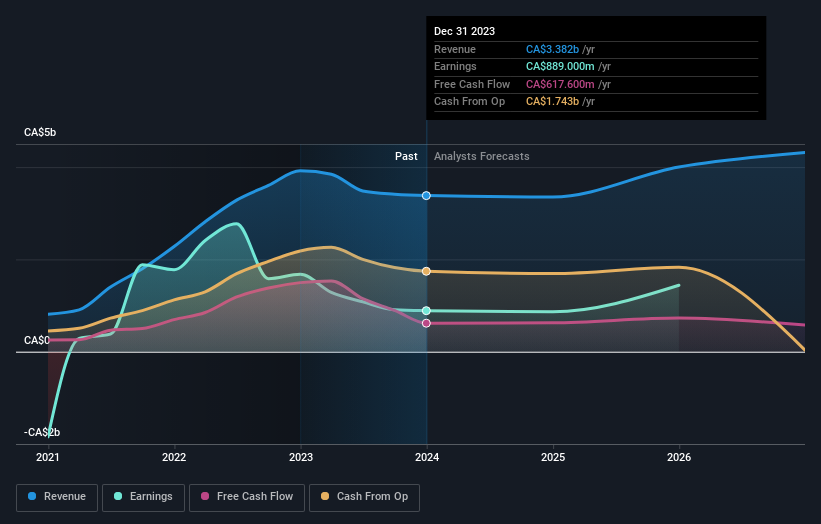
All figures shown in the chart above are for the trailing 12 month (TTM) period
Whitecap Resources Revenues and Earnings Beat Expectations
Revenue exceeded analyst estimates by 14%. Earnings per share (EPS) also surpassed analyst estimates by 13%.
Looking ahead, revenue is forecast to grow 7.2% p.a. on average during the next 3 years, compared to a 5.3% growth forecast for the Oil and Gas industry in Canada.
Performance of the Canadian Oil and Gas industry.
The company's shares are up 9.2% from a week ago.
Valuation
It's possible that Whitecap Resources could be undervalued with our 6-factor valuation analysis indicating a potential opportunity. Discover what analysts are forecasting and how the current share price shapes up by clicking here.
Have feedback on this article? Concerned about the content? Get in touch with us directly. Alternatively, email editorial-team (at) simplywallst.com.
This article by Simply Wall St is general in nature. We provide commentary based on historical data and analyst forecasts only using an unbiased methodology and our articles are not intended to be financial advice. It does not constitute a recommendation to buy or sell any stock, and does not take account of your objectives, or your financial situation. We aim to bring you long-term focused analysis driven by fundamental data. Note that our analysis may not factor in the latest price-sensitive company announcements or qualitative material. Simply Wall St has no position in any stocks mentioned.
