
 Yahoo Finance
 Where Caisse Régionale de Crédit Agricole du Morbihan (EPA:CMO) Stands In Terms Of Earnings Growth Against Its Industry

Understanding Caisse Régionale de Crédit Agricole du Morbihan’s (ENXTPA:CMO) performance as a company requires examining more than earnings from one point in time. Today I will take you through a basic sense check to gain perspective on how Caisse Régionale de Crédit Agricole du Morbihan is doing by evaluating its latest earnings with its longer term trend as well as its industry peers’ performance over the same period. See our latest analysis for Caisse Régionale de Crédit Agricole du Morbihan
How Did CMO’s Recent Performance Stack Up Against Its Past?
I look at the ‘latest twelve-month’ data, which annualizes the latest 6-month earnings release, or some times, the latest annual report is already the most recent financial data. This method enables me to examine many different companies on a similar basis, using the most relevant data points. For Caisse Régionale de Crédit Agricole du Morbihan, its most recent earnings (trailing twelve month) is €53.32M, which, in comparison to last year’s level, has increased by 24.76%. Since these values are somewhat myopic, I’ve computed an annualized five-year figure for Caisse Régionale de Crédit Agricole du Morbihan’s net income, which stands at €44.34M This suggests that, on average, Caisse Régionale de Crédit Agricole du Morbihan has been able to increasingly grow its earnings over the last few years as well.
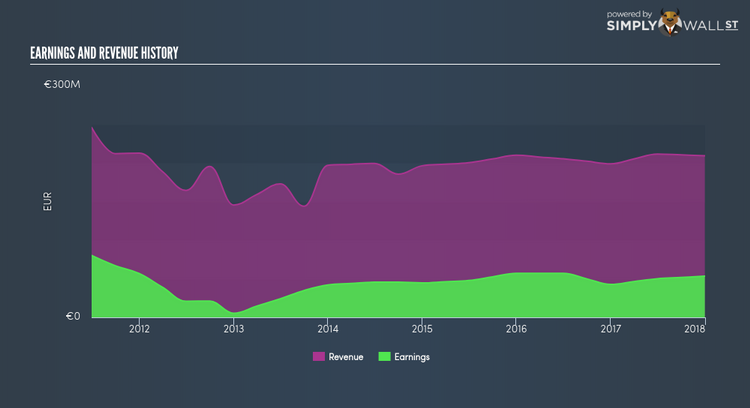
What’s the driver of this growth? Let’s see whether it is merely because of an industry uplift, or if Caisse Régionale de Crédit Agricole du Morbihan has experienced some company-specific growth. In the last couple of years, Caisse Régionale de Crédit Agricole du Morbihan grew its bottom line faster than revenue by efficiently controlling its costs. This has caused a margin expansion and profitability over time. Inspecting growth from a sector-level, the FR banks industry has been relatively flat in terms of earnings growth over the past few years. This means that whatever recent headwind the industry is enduring, Caisse Régionale de Crédit Agricole du Morbihan is relatively better-cushioned than its peers.
What does this mean?
Caisse Régionale de Crédit Agricole du Morbihan’s track record can be a valuable insight into its earnings performance, but it certainly doesn’t tell the whole story. Companies that have performed well in the past, such as Caisse Régionale de Crédit Agricole du Morbihan gives investors conviction. However, the next step would be to assess whether the future looks as optimistic. You should continue to research Caisse Régionale de Crédit Agricole du Morbihan to get a better picture of the stock by looking at:
Financial Health: Is CMO’s operations financially sustainable? Balance sheets can be hard to analyze, which is why we’ve done it for you. Check out our financial health checks here.
Valuation: What is CMO worth today? Is the stock undervalued, even when its growth outlook is factored into its intrinsic value? The intrinsic value infographic in our free research report helps visualize whether CMO is currently mispriced by the market.
Other High-Performing Stocks: Are there other stocks that provide better prospects with proven track records? Explore our free list of these great stocks here.
NB: Figures in this article are calculated using data from the trailing twelve months from 31 December 2017. This may not be consistent with full year annual report figures.
To help readers see pass the short term volatility of the financial market, we aim to bring you a long-term focused research analysis purely driven by fundamental data. Note that our analysis does not factor in the latest price sensitive company announcements.
The author is an independent contributor and at the time of publication had no position in the stocks mentioned.
