
 Yahoo Finance
 Be Wary Of Wee Hur Holdings (SGX:E3B) And Its Returns On Capital
What underlying fundamental trends can indicate that a company might be in decline? Typically, we'll see the trend of both return on capital employed (ROCE) declining and this usually coincides with a decreasing amount of capital employed. This reveals that the company isn't compounding shareholder wealth because returns are falling and its net asset base is shrinking. On that note, looking into Wee Hur Holdings (SGX:E3B), we weren't too upbeat about how things were going.
Return On Capital Employed (ROCE): What Is It?
For those who don't know, ROCE is a measure of a company's yearly pre-tax profit (its return), relative to the capital employed in the business. The formula for this calculation on Wee Hur Holdings is:
Return on Capital Employed = Earnings Before Interest and Tax (EBIT) ÷ (Total Assets - Current Liabilities)
0.00066 = S$338k ÷ (S$713m - S$201m) (Based on the trailing twelve months to June 2023).
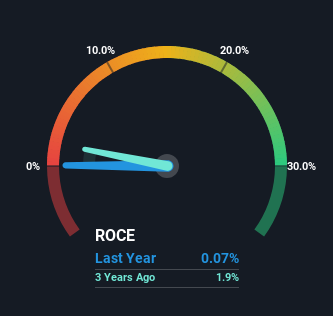
So, Wee Hur Holdings has an ROCE of 0.07%. Ultimately, that's a low return and it under-performs the Construction industry average of 3.6%.
View our latest analysis for Wee Hur Holdings
While the past is not representative of the future, it can be helpful to know how a company has performed historically, which is why we have this chart above. If you'd like to look at how Wee Hur Holdings has performed in the past in other metrics, you can view this free graph of past earnings, revenue and cash flow.
The Trend Of ROCE
We are a bit worried about the trend of returns on capital at Wee Hur Holdings. Unfortunately the returns on capital have diminished from the 11% that they were earning five years ago. On top of that, it's worth noting that the amount of capital employed within the business has remained relatively steady. This combination can be indicative of a mature business that still has areas to deploy capital, but the returns received aren't as high due potentially to new competition or smaller margins. If these trends continue, we wouldn't expect Wee Hur Holdings to turn into a multi-bagger.
On a side note, Wee Hur Holdings has done well to pay down its current liabilities to 28% of total assets. That could partly explain why the ROCE has dropped. What's more, this can reduce some aspects of risk to the business because now the company's suppliers or short-term creditors are funding less of its operations. Some would claim this reduces the business' efficiency at generating ROCE since it is now funding more of the operations with its own money.
In Conclusion...
All in all, the lower returns from the same amount of capital employed aren't exactly signs of a compounding machine. Investors must expect better things on the horizon though because the stock has risen 7.4% in the last five years. Regardless, we don't like the trends as they are and if they persist, we think you might find better investments elsewhere.
On a final note, we've found 1 warning sign for Wee Hur Holdings that we think you should be aware of.
While Wee Hur Holdings may not currently earn the highest returns, we've compiled a list of companies that currently earn more than 25% return on equity. Check out this free list here.
Have feedback on this article? Concerned about the content? Get in touch with us directly. Alternatively, email editorial-team (at) simplywallst.com.
This article by Simply Wall St is general in nature. We provide commentary based on historical data and analyst forecasts only using an unbiased methodology and our articles are not intended to be financial advice. It does not constitute a recommendation to buy or sell any stock, and does not take account of your objectives, or your financial situation. We aim to bring you long-term focused analysis driven by fundamental data. Note that our analysis may not factor in the latest price-sensitive company announcements or qualitative material. Simply Wall St has no position in any stocks mentioned.
