
 Yahoo Finance
 Be Wary Of OKP Holdings (SGX:5CF) And Its Returns On Capital
If you're not sure where to start when looking for the next multi-bagger, there are a few key trends you should keep an eye out for. One common approach is to try and find a company with returns on capital employed (ROCE) that are increasing, in conjunction with a growing amount of capital employed. Basically this means that a company has profitable initiatives that it can continue to reinvest in, which is a trait of a compounding machine. In light of that, when we looked at OKP Holdings (SGX:5CF) and its ROCE trend, we weren't exactly thrilled.
Understanding Return On Capital Employed (ROCE)
Just to clarify if you're unsure, ROCE is a metric for evaluating how much pre-tax income (in percentage terms) a company earns on the capital invested in its business. Analysts use this formula to calculate it for OKP Holdings:
Return on Capital Employed = Earnings Before Interest and Tax (EBIT) ÷ (Total Assets - Current Liabilities)
0.03 = S$6.0m ÷ (S$259m - S$55m) (Based on the trailing twelve months to December 2023).
So, OKP Holdings has an ROCE of 3.0%. Ultimately, that's a low return and it under-performs the Construction industry average of 6.5%.
See our latest analysis for OKP Holdings
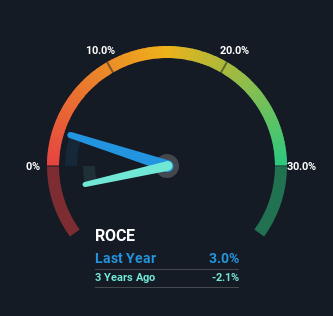
Historical performance is a great place to start when researching a stock so above you can see the gauge for OKP Holdings' ROCE against it's prior returns. If you're interested in investigating OKP Holdings' past further, check out this free graph covering OKP Holdings' past earnings, revenue and cash flow.
What Does the ROCE Trend For OKP Holdings Tell Us?
On the surface, the trend of ROCE at OKP Holdings doesn't inspire confidence. Around five years ago the returns on capital were 5.3%, but since then they've fallen to 3.0%. However, given capital employed and revenue have both increased it appears that the business is currently pursuing growth, at the consequence of short term returns. And if the increased capital generates additional returns, the business, and thus shareholders, will benefit in the long run.
What We Can Learn From OKP Holdings' ROCE
Even though returns on capital have fallen in the short term, we find it promising that revenue and capital employed have both increased for OKP Holdings. And the stock has followed suit returning a meaningful 54% to shareholders over the last five years. So should these growth trends continue, we'd be optimistic on the stock going forward.
If you'd like to know about the risks facing OKP Holdings, we've discovered 1 warning sign that you should be aware of.
For those who like to invest in solid companies, check out this free list of companies with solid balance sheets and high returns on equity.
Have feedback on this article? Concerned about the content? Get in touch with us directly. Alternatively, email editorial-team (at) simplywallst.com.
This article by Simply Wall St is general in nature. We provide commentary based on historical data and analyst forecasts only using an unbiased methodology and our articles are not intended to be financial advice. It does not constitute a recommendation to buy or sell any stock, and does not take account of your objectives, or your financial situation. We aim to bring you long-term focused analysis driven by fundamental data. Note that our analysis may not factor in the latest price-sensitive company announcements or qualitative material. Simply Wall St has no position in any stocks mentioned.
