
 Yahoo Finance
 Be Wary Of Chasen Holdings (SGX:5NV) And Its Returns On Capital
What trends should we look for it we want to identify stocks that can multiply in value over the long term? Ideally, a business will show two trends; firstly a growing return on capital employed (ROCE) and secondly, an increasing amount of capital employed. If you see this, it typically means it's a company with a great business model and plenty of profitable reinvestment opportunities. In light of that, when we looked at Chasen Holdings (SGX:5NV) and its ROCE trend, we weren't exactly thrilled.
Understanding Return On Capital Employed (ROCE)
If you haven't worked with ROCE before, it measures the 'return' (pre-tax profit) a company generates from capital employed in its business. To calculate this metric for Chasen Holdings, this is the formula:
Return on Capital Employed = Earnings Before Interest and Tax (EBIT) ÷ (Total Assets - Current Liabilities)
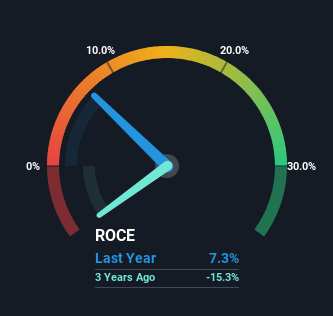
0.073 = S$9.0m ÷ (S$213m - S$91m) (Based on the trailing twelve months to September 2023).
Therefore, Chasen Holdings has an ROCE of 7.3%. On its own that's a low return on capital but it's in line with the industry's average returns of 6.6%.
View our latest analysis for Chasen Holdings
While the past is not representative of the future, it can be helpful to know how a company has performed historically, which is why we have this chart above. If you want to delve into the historical earnings , check out these free graphs detailing revenue and cash flow performance of Chasen Holdings.
What Can We Tell From Chasen Holdings' ROCE Trend?
When we looked at the ROCE trend at Chasen Holdings, we didn't gain much confidence. Around five years ago the returns on capital were 9.4%, but since then they've fallen to 7.3%. However it looks like Chasen Holdings might be reinvesting for long term growth because while capital employed has increased, the company's sales haven't changed much in the last 12 months. It may take some time before the company starts to see any change in earnings from these investments.
Another thing to note, Chasen Holdings has a high ratio of current liabilities to total assets of 43%. This effectively means that suppliers (or short-term creditors) are funding a large portion of the business, so just be aware that this can introduce some elements of risk. Ideally we'd like to see this reduce as that would mean fewer obligations bearing risks.
What We Can Learn From Chasen Holdings' ROCE
In summary, Chasen Holdings is reinvesting funds back into the business for growth but unfortunately it looks like sales haven't increased much just yet. And investors may be recognizing these trends since the stock has only returned a total of 37% to shareholders over the last five years. As a result, if you're hunting for a multi-bagger, we think you'd have more luck elsewhere.
Chasen Holdings does have some risks, we noticed 3 warning signs (and 2 which are significant) we think you should know about.
If you want to search for solid companies with great earnings, check out this free list of companies with good balance sheets and impressive returns on equity.
Have feedback on this article? Concerned about the content? Get in touch with us directly. Alternatively, email editorial-team (at) simplywallst.com.
This article by Simply Wall St is general in nature. We provide commentary based on historical data and analyst forecasts only using an unbiased methodology and our articles are not intended to be financial advice. It does not constitute a recommendation to buy or sell any stock, and does not take account of your objectives, or your financial situation. We aim to bring you long-term focused analysis driven by fundamental data. Note that our analysis may not factor in the latest price-sensitive company announcements or qualitative material. Simply Wall St has no position in any stocks mentioned.
