
 Yahoo Finance
 Want To Invest In Hotel Royal Limited (SGX:H12)? Here’s How It Performed Lately

Assessing Hotel Royal Limited’s (SGX:H12) past track record of performance is a valuable exercise for investors. It enables us to reflect on whether the company has met or exceed expectations, which is a great indicator for future performance. Today I will assess H12’s recent performance announced on 31 March 2018 and evaluate these figures to its longer term trend and industry movements. View out our latest analysis for Hotel Royal
Despite a decline, did H12 underperform the long-term trend and the industry?
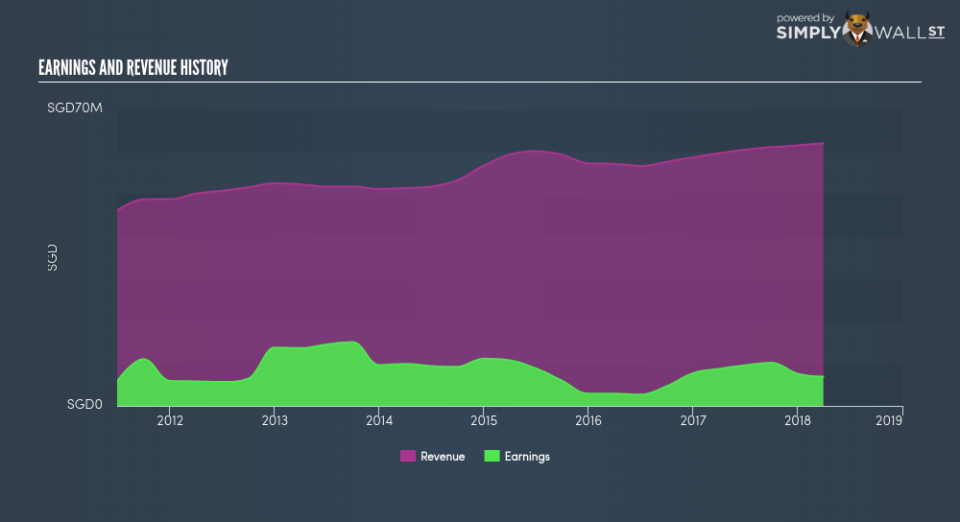
H12’s trailing twelve-month earnings (from 31 March 2018) of S$6.92m has declined by -20.89% compared to the previous year. Furthermore, this one-year growth rate has been lower than its average earnings growth rate over the past 5 years of -4.38%, indicating the rate at which H12 is growing has slowed down. What could be happening here? Let’s examine what’s occurring with margins and whether the whole industry is feeling the heat.
Revenue growth in the last few years, has been positive, nevertheless earnings growth has been falling. This means Hotel Royal has been growing expenses, which is harming margins and earnings, and is not a sustainable practice. Scanning growth from a sector-level, the SG hospitality industry has been growing its average earnings by double-digit 36.36% in the previous year, and a flatter -1.65% over the last five years. This means that, in the recent industry expansion, Hotel Royal has not been able to gain as much as its industry peers.
In terms of returns from investment, Hotel Royal has not invested its equity funds well, leading to a 1.23% return on equity (ROE), below the sensible minimum of 20%. Furthermore, its return on assets (ROA) of 1.53% is below the SG Hospitality industry of 4.12%, indicating Hotel Royal’s are utilized less efficiently. And finally, its return on capital (ROC), which also accounts for Hotel Royal’s debt level, has declined over the past 3 years from 1.97% to 1.55%. This correlates with an increase in debt holding, with debt-to-equity ratio rising from 24.54% to 26.86% over the past 5 years.
What does this mean?
Though Hotel Royal’s past data is helpful, it is only one aspect of my investment thesis. Generally companies that experience a prolonged period of decline in earnings are undergoing some sort of reinvestment phase with the aim of keeping up with the recent industry disruption and expansion. I suggest you continue to research Hotel Royal to get a more holistic view of the stock by looking at:
Future Outlook: What are well-informed industry analysts predicting for H12’s future growth? Take a look at our free research report of analyst consensus for H12’s outlook.
Financial Health: Is H12’s operations financially sustainable? Balance sheets can be hard to analyze, which is why we’ve done it for you. Check out our financial health checks here.
Other High-Performing Stocks: Are there other stocks that provide better prospects with proven track records? Explore our free list of these great stocks here.
NB: Figures in this article are calculated using data from the trailing twelve months from 31 March 2018. This may not be consistent with full year annual report figures.
To help readers see pass the short term volatility of the financial market, we aim to bring you a long-term focused research analysis purely driven by fundamental data. Note that our analysis does not factor in the latest price sensitive company announcements.
The author is an independent contributor and at the time of publication had no position in the stocks mentioned.
