
 Yahoo Finance
 Want To Invest In Hong Leong Finance Limited (SGX:S41)? Here’s How It Performed Lately

In this article, I will take a look at Hong Leong Finance Limited’s (SGX:S41) most recent earnings update (31 March 2018) and compare these latest figures against its performance over the past few years, along with how the rest of S41’s industry performed. As a long-term investor, I find it useful to analyze the company’s trend over time in order to estimate whether or not the company is able to meet its goals, and eventually grow sustainably over time. Check out our latest analysis for Hong Leong Finance
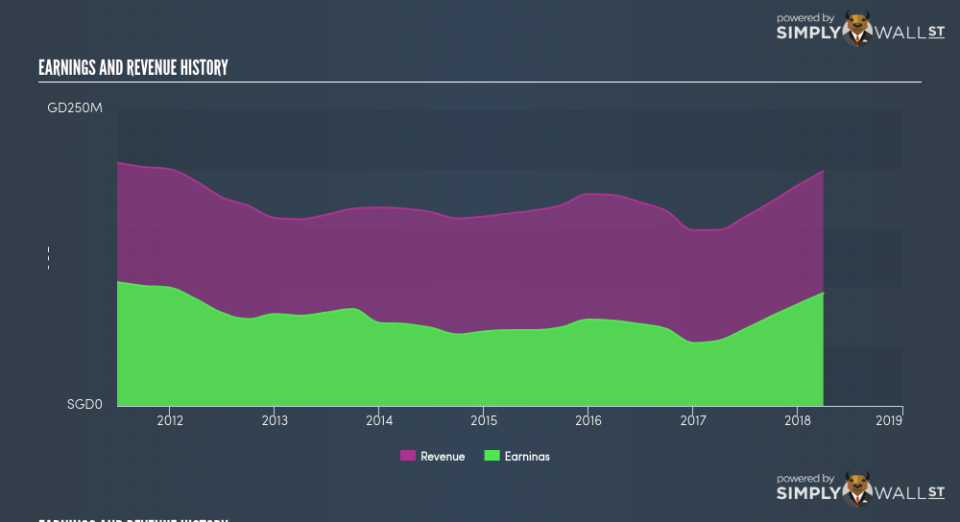
How Did S41’s Recent Performance Stack Up Against Its Past?
S41’s trailing twelve-month earnings (from 31 March 2018) of S$95.08m has jumped 72.92% compared to the previous year. Furthermore, this one-year growth rate has exceeded its 5-year annual growth average of -4.41%, indicating the rate at which S41 is growing has accelerated. What’s enabled this growth? Let’s see whether it is solely owing to an industry uplift, or if Hong Leong Finance has experienced some company-specific growth.
Although both top-line and bottom-line growth rates in the past couple of years were on average negative, earnings were more so. While this has caused a margin contraction, it has cushioned Hong Leong Finance’s earnings contraction. Scanning growth from a sector-level, the SG consumer finance industry has been growing its average earnings by double-digit 17.30% over the prior year, and 10.00% over the past half a decade. This suggests that whatever tailwind the industry is benefiting from, Hong Leong Finance is capable of leveraging this to its advantage.
In terms of returns from investment, Hong Leong Finance has not invested its equity funds well, leading to a 5.16% return on equity (ROE), below the sensible minimum of 20%. Furthermore, its return on assets (ROA) of 0.72% is below the SG Consumer Finance industry of 2.47%, indicating Hong Leong Finance’s are utilized less efficiently. However, its return on capital (ROC), which also accounts for Hong Leong Finance’s debt level, has increased over the past 3 years from 4.61% to 6.19%.
What does this mean?
Hong Leong Finance’s track record can be a valuable insight into its earnings performance, but it certainly doesn’t tell the whole story. Positive growth and profitability are what investors like to see in a company’s track record, but how do we properly assess sustainability? You should continue to research Hong Leong Finance to get a better picture of the stock by looking at:
Future Outlook: What are well-informed industry analysts predicting for S41’s future growth? Take a look at our free research report of analyst consensus for S41’s outlook.
Financial Health: Is S41’s operations financially sustainable? Balance sheets can be hard to analyze, which is why we’ve done it for you. Check out our financial health checks here.
Other High-Performing Stocks: Are there other stocks that provide better prospects with proven track records? Explore our free list of these great stocks here.
NB: Figures in this article are calculated using data from the trailing twelve months from 31 March 2018. This may not be consistent with full year annual report figures.
To help readers see pass the short term volatility of the financial market, we aim to bring you a long-term focused research analysis purely driven by fundamental data. Note that our analysis does not factor in the latest price sensitive company announcements.
The author is an independent contributor and at the time of publication had no position in the stocks mentioned.
