
 Yahoo Finance
 Volatility Risks Warn of big Moves. We Prefer this Trading Strategy
DailyFX.com -
- Forex volatility prices fall somewhat, but risks remain elevated on critical two weeks ahead
- Our focus remains on our high-volatility Breakout2 trading strategy
- Real data shows that most retail traders do poorly in volatile markets, caution remains advised
The US Dollar may continue to see big moves on what promises to be a critical two weeks across financial markets. Here are the currency pairs and strategies we’re watching.
FX volatility prices have fallen somewhat on a relatively limited week of global economic event risk ahead, but we think this could prove the calm before the storm as the following week promises substantial volatility. And indeed our DailyFX volatility indices show that 1-week expectations have dipped while longer-term derivatives show risks remain quite elevated.
One-week Forex Volatility Prices Fall, but Overall Volatility Risks Remain Elevated
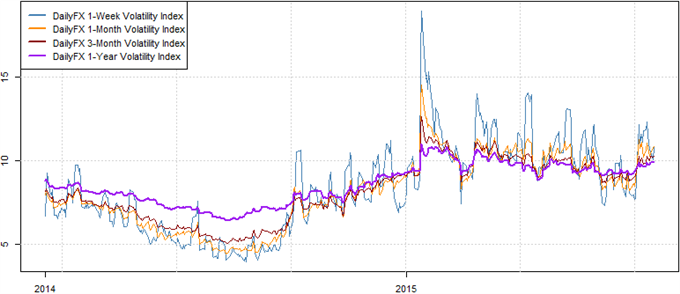
Data source: Bloomberg, DailyFX Calculations
It’s important to reiterate something we said last week: our data shows that the majority of retail FX traders tend to do poorly in times of elevated market volatility. Past performance is not necessarily indicative of future results and elevated FX volatility prices do not guarantee that we will see big moves in the days ahead. Yet as traders we prefer to play the probabilities, and current market conditions warn that it may be another challenging week for traders.
Our data shows that the majority of retail traders tend to range trade—buy when prices are low and sell when prices are high. This works well during quiet market conditions, but such a technique is also likely to do poorly during fast-moving markets and traders should likely avoid range trading until we see some semblance of ‘normalcy’ in currency trading markets.
In the meantime we’ll look to our volatility-friendly Breakout2 to continue to outperform across key US Dollar and Japanese Yen pairs.
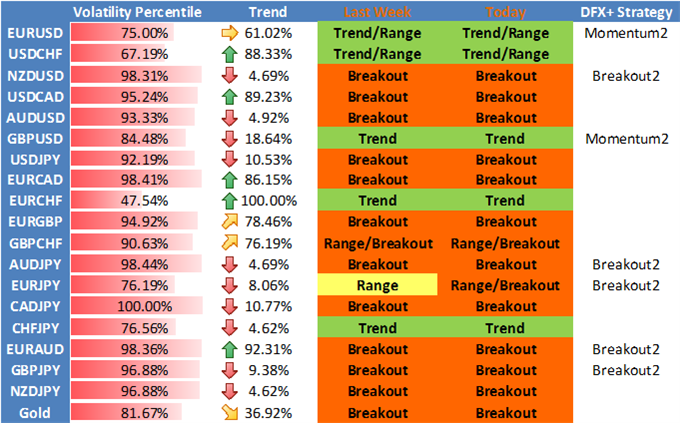
See the table below for full detail on market conditions and preferred trading strategies.
DailyFX Individual Currency Pair Conditions and Trading Strategy Bias
Understand the Breakout2 Trading System via our previous article
Auto trade the trend reversal-trading Momentum2system via our previous article.
Trade with strong trends via our Momentum1 Trading System
Use our counter-trend Range2 Trading system
--- Written by David Rodriguez, Quantitative Strategist for DailyFX.com
To receive the Speculative Sentiment Index and other reports from this author via e-mail, sign up to David’s e-mail distribution list via this link.
Contact David via Twitter at http://www.twitter.com/DRodriguezFX
Definitions
Volatility Percentile – The higher the number, the more likely we are to see strong movements in price. This number tells us where current implied volatility levels stand in relation to the past 90 days of trading. We have found that implied volatilities tend to remain very high or very low for extended periods of time. As such, it is helpful to know where the current implied volatility level stands in relation to its medium-term range.
Trend – This indicator measures trend intensity by telling us where price stands in relation to its 90 trading-day range. A very low number tells us that price is currently at or near 90-day lows, while a higher number tells us that we are near the highs. A value at or near 50 percent tells us that we are at the middle of the currency pair’s 90-day range.
Range High – 90-day closing high.
Range Low – 90-day closing low.
Last – Current market price.
Bias – Based on the above criteria, we assign the more likely profitable strategy for any given currency pair. A highly volatile currency pair (Volatility Percentile very high) suggests that we should look to use Breakout strategies. More moderate volatility levels and strong Trend values make Momentum trades more attractive, while the lowest Vol Percentile and Trend indicator figures make Range Trading the more attractive strategy.
HYPOTHETICAL PERFORMANCE RESULTS HAVE MANY INHERENT LIMITATIONS, SOME OF WHICH ARE DESCRIBED BELOW. NO REPRESENTATION IS BEING MADE THAT ANY ACCOUNT WILL OR IS LIKELY TO ACHIEVE PROFITS OR LOSSES SIMILAR TO THOSE SHOWN. IN FACT, THERE ARE FREQUENTLY SHARP DIFFERENCES BETWEEN HYPOTHETICAL PERFORMANCE RESULTS AND THE ACTUAL RESULTS SUBSEQUENTLY ACHIEVED BY ANY PARTICULAR TRADING PROGRAM.
ONE OF THE LIMITATIONS OF HYPOTHETICAL PERFORMANCE RESULTS IS THAT THEY ARE GENERALLY PREPARED WITH THE BENEFIT OF HINDSIGHT. IN ADDITION, HYPOTHETICAL TRADING DOES NOT INVOLVE FINANCIAL RISK, AND NO HYPOTHETICAL TRADING RECORD CAN COMPLETELY ACCOUNT FOR THE IMPACT OF FINANCIAL RISK IN ACTUAL TRADING. FOR EXAMPLE, THE ABILITY TO WITHSTAND LOSSES OR TO ADHERE TO A PARTICULAR TRADING PROGRAM IN SPITE OF TRADING LOSSES IS MATERIAL POINTS WHICH CAN ALSO ADVERSELY AFFECT ACTUAL TRADING RESULTS. THERE ARE NUMEROUS OTHER FACTORS RELATED TO THE MARKETS IN GENERAL OR TO THE IMPLEMENTATION.
OF ANY SPECIFIC TRADING PROGRAM WHICH CANNOT BE FULLY ACCOUNTED FOR IN THE PREPARATION OF HYPOTHETICAL PERFORMANCE RESULTS AND ALL OF WHICH CAN ADVERSELY AFFECT ACTUAL TRADING RESULTS.
Any opinions, news, research, analyses, prices, or other information contained on this website is provided as general market commentary, and does not constitute investment advice. The FXCM group will not accept liability for any loss or damage, including without limitation to, any loss of profit, which may arise directly or indirectly from use of or reliance contained in the trading signals, or in any accompanying chart analyses.
http://www.dailyfx.com/forex/technical/article/forex_strategy_corner/2013/02/06/forex_crowd_breakout_trading.html?CMP=SFS-70160000000NbT3AAK
DailyFX provides forex news and technical analysis on the trends that influence the global currency markets.
Learn forex trading with a free practice account and trading charts from FXCM.
