
 Yahoo Finance
 Visteon (NASDAQ:VC) Hasn't Managed To Accelerate Its Returns
What are the early trends we should look for to identify a stock that could multiply in value over the long term? Firstly, we'd want to identify a growing return on capital employed (ROCE) and then alongside that, an ever-increasing base of capital employed. This shows us that it's a compounding machine, able to continually reinvest its earnings back into the business and generate higher returns. With that in mind, the ROCE of Visteon (NASDAQ:VC) looks decent, right now, so lets see what the trend of returns can tell us.
Understanding Return On Capital Employed (ROCE)
If you haven't worked with ROCE before, it measures the 'return' (pre-tax profit) a company generates from capital employed in its business. The formula for this calculation on Visteon is:
Return on Capital Employed = Earnings Before Interest and Tax (EBIT) ÷ (Total Assets - Current Liabilities)
0.16 = US$291m ÷ (US$2.7b - US$931m) (Based on the trailing twelve months to December 2023).
Therefore, Visteon has an ROCE of 16%. In absolute terms, that's a satisfactory return, but compared to the Auto Components industry average of 11% it's much better.
See our latest analysis for Visteon
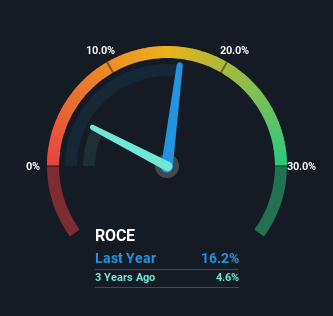
Above you can see how the current ROCE for Visteon compares to its prior returns on capital, but there's only so much you can tell from the past. If you're interested, you can view the analysts predictions in our free analyst report for Visteon .
So How Is Visteon's ROCE Trending?
While the current returns on capital are decent, they haven't changed much. Over the past five years, ROCE has remained relatively flat at around 16% and the business has deployed 40% more capital into its operations. Since 16% is a moderate ROCE though, it's good to see a business can continue to reinvest at these decent rates of return. Over long periods of time, returns like these might not be too exciting, but with consistency they can pay off in terms of share price returns.
The Key Takeaway
The main thing to remember is that Visteon has proven its ability to continually reinvest at respectable rates of return. However, over the last five years, the stock has only delivered a 34% return to shareholders who held over that period. That's why it could be worth your time looking into this stock further to discover if it has more traits of a multi-bagger.
On a separate note, we've found 2 warning signs for Visteon you'll probably want to know about.
For those who like to invest in solid companies, check out this free list of companies with solid balance sheets and high returns on equity.
Have feedback on this article? Concerned about the content? Get in touch with us directly. Alternatively, email editorial-team (at) simplywallst.com.
This article by Simply Wall St is general in nature. We provide commentary based on historical data and analyst forecasts only using an unbiased methodology and our articles are not intended to be financial advice. It does not constitute a recommendation to buy or sell any stock, and does not take account of your objectives, or your financial situation. We aim to bring you long-term focused analysis driven by fundamental data. Note that our analysis may not factor in the latest price-sensitive company announcements or qualitative material. Simply Wall St has no position in any stocks mentioned.
