
 Yahoo Finance
 Visa (V) Q2 Earnings Beat on Volume Growth & Consumer Spending
Visa Inc. V reported strong second-quarter fiscal 2024 results, which benefited from expanding payments volume, cross-border volume and processed transactions.
Despite challenges, such as a high interest rate environment, more than average inflation level and concerns about the economic slowdown, resilient consumer spending and strong e-commerce trends supported Visa's performance. However, higher operating expenses and client incentives partially tempered the upside.
Its earnings per share (EPS) of $2.51 outpaced the Zacks Consensus Estimate of $2.43 by 3.3%. The bottom line rose 20% year over year.
Also, net revenues improved 10% year over year to $8.8 billion in the quarter under review. The top line beat the consensus mark by 2.1%.
Visa Inc. Price, Consensus and EPS Surprise
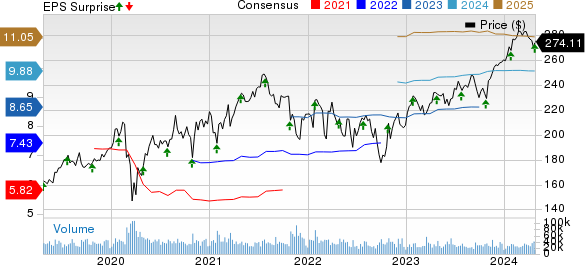
Visa Inc. price-consensus-eps-surprise-chart | Visa Inc. Quote
Growth in Business Drivers
Visa's payments volume increased 8% year over year on a constant-dollar basis in the fiscal second quarter, attributable to expanding operations across Europe, CEMEA and LAC regions. Processed transactions (implying transactions processed by Visa) grew 11% year over year to 55.5 billion and beat our estimate of 54.7 billion.
On a constant-dollar basis, the cross-border volume of Visa climbed 16% year over year in the quarter under review. Excluding transactions within Europe, its cross-border volume (that boosts a company’s international transaction revenues) also rose 16% year over year on a constant-dollar basis.
Q2 Operational Performance
Service revenues (depends on payments volume in the previous quarter) of $4 billion grew 7% year over year in the March quarter on the back of improved payment volumes. The figure marginally missed our estimate of $4.1 billion. Data processing revenues of the company climbed 12% year over year to almost $4.3 billion, which met both the Zacks Consensus Estimate and our estimate.
International transaction revenues amounted to almost $3 billion, which improved 9% year over year in the fiscal second quarter. The metric benefited from increased cross-border volume but missed the consensus mark by 1.4% and our estimate by 2.3%. Other revenues rose 37% year over year to $756 million, which beat the Zacks Consensus Estimate and our estimate by more than 15% and 18%, respectively.
Client incentives (a contra-revenue item) escalated 12% year over year to $3.3 billion in the quarter under review but were lower than both the Zacks Consensus Estimate and our estimate of $3.4 billion. The metric accounted for 27.1% of the company’s gross revenues of $12 billion.
Operating expenses of Visa jumped 29% year over year to $3.4 billion in the fiscal second quarter due to higher personnel, marketing, network and processing, professional feesand G&A expenses. Interest expenses of $82 million declined from $142 million reported in the year-ago period.
Balance Sheet (as of Mar 31, 2024)
Visa exited the March quarter with cash and cash equivalents of $13 billion, which declined from the fiscal 2023 year-end level of $16.3 billion. Total assets of $92.4 billion rose from the fiscal 2023 year-end figure of $90.5 billion.
Visa’s long-term debt amounted to $20.6 billion, which inched up from the fiscal 2023 year-end level of $20.5 billion.
Total equity of $40.5 billion increased from the fiscal 2023 year-end figure of $38.7 billion.
Decline in Cash Flows
The company generated net cash from operations of $4.5 billion in the fiscal second quarter, which increased 17.6% year over year. Free cash flows are recorded at $4.3 billion, up 16.6% year over year.
Capital Deployment Update
Visa rewarded $3.8 billion to shareholders via share buybacks ($2.7 billion) and dividends ($1.1 billion) in the March quarter. V had leftover authorized funds of $23.6 billion under its repurchase program as of Mar 31, 2024.
On Apr 23, 2024, management sanctioned a quarterly cash dividend of 52 cents per share, which will be paid out on Jun 3, to shareholders of record as of May 17.
Fiscal 3Q24 Outlook
On an adjusted constant-dollar basis, net revenues are anticipated to witness low double-digit growth. Operating expenses are estimated to grow in the low teens on an adjusted constant-dollar basis. It expects EPS to witness the high end of low double-digit growth.
Fiscal 2024 View
Management continues to expect net revenues to grow in low double digits on an adjusted constant-dollar basis in fiscal 2024. Operating expense is expected to witness low double-digit growth on an adjusted constant-dollar basis. It also anticipates EPS to witness growth in the low teens.
Amortization of acquired intangible assets is projected at around $180 million or 7 cents per share. Acquisition-related costs are expected at roughly $115 million or 5 cents per share.
Zacks Rank & Key Picks
Visa currently has a Zacks Rank #3 (Hold).
Some better-ranked stocks in the broader Business Services space are MoneyLion Inc. ML, Flywire Corporation FLYW and FirstCash Holdings, Inc. FCFS, each carrying a Zacks Rank #2 (Buy) at present. You can see the complete list of today’s Zacks #1 Rank (Strong Buy) stocks here.
The Zacks Consensus Estimate for MoneyLion’s current-year bottom line indicates a 98.7% year-over-year improvement. The consensus estimate for ML’s current-year top line is pegged at $518.9 million, suggesting 22.6% year-over-year growth.
The Zacks Consensus Estimate for Flywire’s current year earnings is pegged at 5 cents per share, which indicates a 171.4% year-over-year improvement. FLYW beat earnings estimates in two of the trailing four quarters, met once and missed on the other occasion, with an average surprise of 33.1%. The consensus estimate for current-year revenues suggests 29.9% year-over-year growth.
The Zacks Consensus Estimate for FirstCash’s current-year earnings is pegged at $6.93 per share, which indicates 14.4% growth from the year-ago period. FCFS beat earnings estimates in each of the trailing four quarters, with an average surprise of 8.1%. The consensus mark for current-year revenues implies a 10.4% year-over-year increase.
Want the latest recommendations from Zacks Investment Research? Today, you can download 7 Best Stocks for the Next 30 Days. Click to get this free report
Visa Inc. (V) : Free Stock Analysis Report
FirstCash Holdings, Inc. (FCFS) : Free Stock Analysis Report
MoneyLion Inc. (ML) : Free Stock Analysis Report
Flywire Corporation (FLYW) : Free Stock Analysis Report
