
 Yahoo Finance
 USD/JPY Technical Analysis 04.12.2013
USD/JPY Technical Analysis- Prices broke resistance at 98.42, the 100% Fibonacci extension, exposing the 123.6% level at 99.80. A further push above that eyes the 138.2% level at 100.65. The 98.42 level has been recast as near-term support, with a reversal back beneath that eyeing the 76.4% Fib at 97.03. Negative RSI divergence and the Harami candlestick pattern appear to hint in favor of a downside scenario.
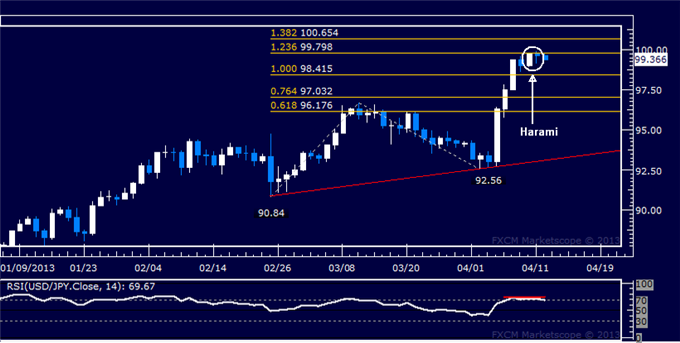
Daily Chart - Created Using FXCM Marketscope 2.0
Want to back-test your technical trading strategy? Download the historical data here.
--- Written by Ilya Spivak, Currency Strategist for Dailyfx.com
To contact Ilya, e-mail ispivak@dailyfx.com. Follow Ilya on Twitter at @IlyaSpivak
To be added to Ilya's e-mail distribution list, please CLICK HERE
New to FX? Watch this Video. For live market updates, visit the Real Time News Feed
DailyFX provides forex news and technical analysis on the trends that influence the global currency markets.
Learn forex trading with a free practice account and trading charts from FXCM.
