
 Yahoo Finance
 USD/JPY Forex Technical Analysis – June 25, 2019 Forecast
The Dollar/Yen is trading at a multi-month low early Tuesday as investors continue to increase bets on a Federal Reserve rate cut at the end of July. While expectations of a Fed rate cut are weakening the U.S. Dollar, safe-haven demand due to worries over U.S.-China trade relations and Middle East tensions are driving up the Japanese Yen.
At 06:02 GMT, the USD/JPY is trading 107.030, down 0.268 or -0.25%.
Asian stock markets are trading lower because investors are starting to believe the meeting between US President Trump and Chinese President Xi Jinping at the G20 summit in Osaka, Japan will be fruitless. This increases the chances of President Trump imposing another $300 billion in tariffs on China.
Daily Technical Analysis
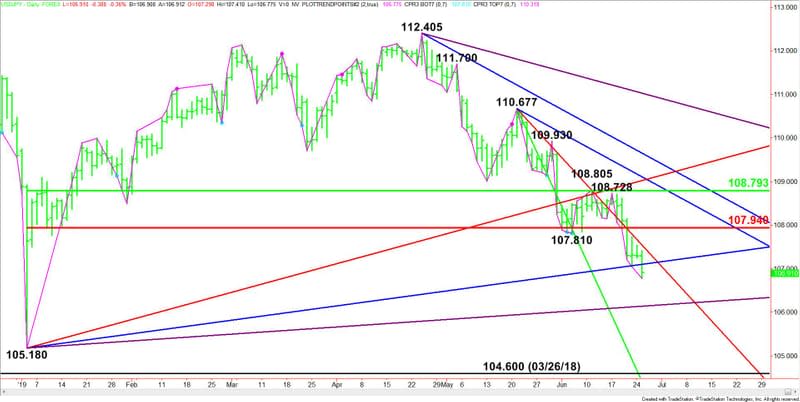
The main trend is down according to the daily swing chart. The downtrend was reaffirmed earlier today when sellers took out last week’s low at 107.045. Due to an intraday technical bounce, the downtrend will resume later today if 106.775 is taken out.
The main trend will change to up on a trade through 108.728. This is highly unlikely however.
Traders should also watch the market’s reaction to 107.298, 107.310 and 107.305. These are the last three closes. Closing over these levels will likely indicate the worst of the selling is over.
The main range is 105.180 to 112.405. Its retracement zone at 107.940 to 108.793 is controlling the direction of the USD/JPY. Consider it resistance.
Daily Technical Forecast
Based on the early trade, the direction of the USD/JPY the rest of the session is likely to be determined by trader reaction to the uptrending Gann angle at 107.102.
Bearish Scenario
A sustained move under 107.102 will indicate the presence of sellers. If this move is able to generate enough downside momentum then we could see a test of the next uptrending Gann angle at 106.141 over the near-term.
Bullish Scenario
A sustained move over 107.102 will signal the return of buyers. This could lead to a test of the three previous closes at 107.298, 107.310 and 107.305.
Overtaking the closes should create the upside momentum needed to challenge the downtrending Gann angle 107.552. This angle is important because it has been guiding the USD/JPY lower since May 21. Overcoming this angle could shift sentiment to the upside with the next target the Fibonacci level at 107.940.
This article was originally posted on FX Empire
