
 Yahoo Finance
 USD/CNY Price Forecast – Verging On Major Breakout
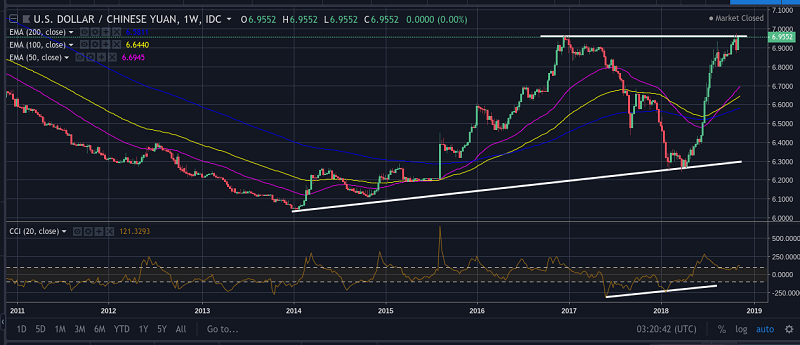
The U.S. dollar is in the midst of a two-stage breakout relative to its long-term performance against the Chinese yuan. The greenback began its major advance in the early parts of 2014, and these trends continued for almost three straight years before showing signs of reversal. The USD/CNY forex pair then fell back through its long-term moving averages before finding its footing in the middle of April of this year. The bull rallies which have followed have been forceful, and the pair now appears to be on the verge of a major breakout which could send its valuations significantly higher.
Critical Resistance: 6.9633
Critical Support: 6.2419
Trading Bias: Bullish
USD/CNY Forex Strategy: Buy Breakout of 6.9650
The latest impulse moves in USD/CNY have sent the pair back through all of its major moving averages. Activity in the moving averages themselves confirms this activity, as the 50-week EMA has broken above both the 100-week EMA and the 200-week EMA. Indicator readings are bullish, with the CCI holding within its mid-range levels. This suggests the pair has not yet reached over-extended levels (despite this significant run higher).
The balance of the evidence here strongly suggests a bullish potential for continued moves higher. Breakout traders can look to establish buy positions on a violation of resistance at 6.9633, which marks the prior highs from the end of 2016. Alternatively, a downside break of prior support at 6.8685 suggests a period of sideways stalling in the pair. Given the extent of the market’s previous run higher, a move like this would not be entirely surprising. Directional behavior in the EMAs for the USD/CNY pair appears to be readying for a more elevated approach, so traders can look to these indicators for further evidence of reversal within the dominant trends.
This article was originally posted on FX Empire
More From FXEMPIRE:
Crude Oil Price Update – New Minor Bottom at $59.45, First Upside Target Angle at $62.55
GBP/JPY Price Forecast – British pound gapped lower against yen
GBP/USD Price Forecast – British pound falls to kick off week
EUR/USD Mid-Session Technical Analysis for November 12, 2018
Saudi Arabia Shocks Global Market, Tech Drags On EU, US Dollar Surges To New High
