
 Yahoo Finance
 USD/CAD - Minor Top or Just A Consolidation?
DailyFX.com -
Talking Points
USD/CAD testing key support zone
Broader technical picture still quite positive
Unfamiliar with Gann Square Root Relationships? Learn more about them HERE.
USD/CAD continues to chop around in a sideways to lower range below the 1.3212 multi-year high recorded earlier in the month. Following the breakout in July above the 2009 high the medium-to long-term technical outlook is clearly favorable with a move through Fibonacci resistance at 1.3170 and of course the high at 1.3212 needed to set off a run higher towards the 61.8% retracement of the 2002 – 2007 decline near 1.3500. The current correction from the high has been relatively tame thus far given some of the other moves in G10 FX. Of course a lot of this has to do with the relentless offer in crude, though with sentiment in the commodity falling to contrarian “red flag” levels of just 6% bulls yesterday the time may be approaching for at least a modest turn around in oil and CAD. The low end of a median line channel drawn from the May low has supported downside attempts thus far, but is getting tested again today. A daily close below this level (currently around 1.3080) would be an early warning sign that the correction is starting to gain some traction. However, a clear break of last week’s low near 1.2950 is probably needed to turn the near-term technical picture more convincingly negative.
To receive other reports from this author via e-mail, sign up to Kristian’s e-mail distribution list via this link.
USD/CAD Daily Chart: August 21, 2015
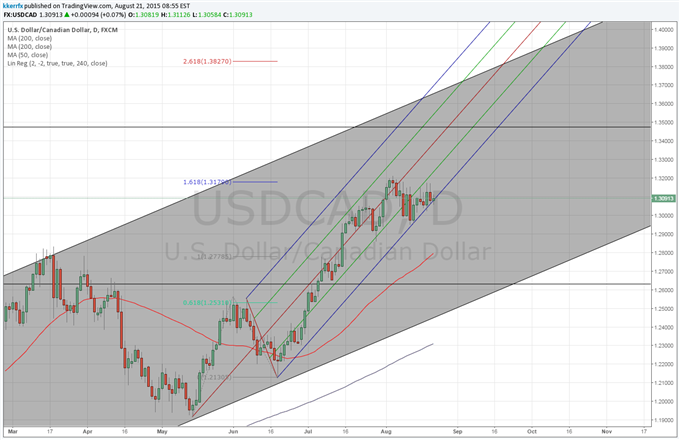
Chart Prepared by Kristian Kerr
LEVELS TO WATCH
Resistance: 1.3170 (Fibonacci), 1.3212 (MTD high)
Support: 1.3080 (Andrews), 1.2950 (MTD low)
Strategy: Sell USD/CAD on a break
Entry: More aggressive traders can look to sell funds on a close below 1.3080 while my conservative traders can wait for a move under 1.2950 before looking to sell on rallies.
Stop: Daily close back over 1.3170
Target: Open
--- Written by Kristian Kerr, Senior Currency Strategist for DailyFX.com
To contact Kristian, e-mail kkerr@fxcm.com. Follow me on Twitter at@KKerrFX.
DailyFX provides forex news and technical analysis on the trends that influence the global currency markets.
Learn forex trading with a free practice account and trading charts from FXCM.
