Advertisement
Singapore markets closed
  • Straits Times Index

    3,280.10
    -7.65 (-0.23%)
     
  • Nikkei

    37,934.76
    +306.28 (+0.81%)
     
  • Hang Seng

    17,651.15
    +366.61 (+2.12%)
     
  • FTSE 100

    8,107.61
    +28.75 (+0.36%)
     
  • Bitcoin USD

    64,344.34
    +892.54 (+1.41%)
     
  • CMC Crypto 200

    1,391.37
    -5.17 (-0.37%)
     
  • S&P 500

    5,048.42
    -23.21 (-0.46%)
     
  • Dow

    38,085.80
    -375.12 (-0.98%)
     
  • Nasdaq

    15,611.76
    -100.99 (-0.64%)
     
  • Gold

    2,360.70
    +18.20 (+0.78%)
     
  • Crude Oil

    83.90
    +0.33 (+0.39%)
     
  • 10-Yr Bond

    4.7060
    +0.0540 (+1.16%)
     
  • FTSE Bursa Malaysia

    1,575.16
    +5.91 (+0.38%)
     
  • Jakarta Composite Index

    7,036.08
    -119.22 (-1.67%)
     
  • PSE Index

    6,628.75
    +53.87 (+0.82%)
     

USD/CAD Drops into 55 Day Average

DailyFX.com -

Weekly

USD/CAD Drops into 55 Day Average

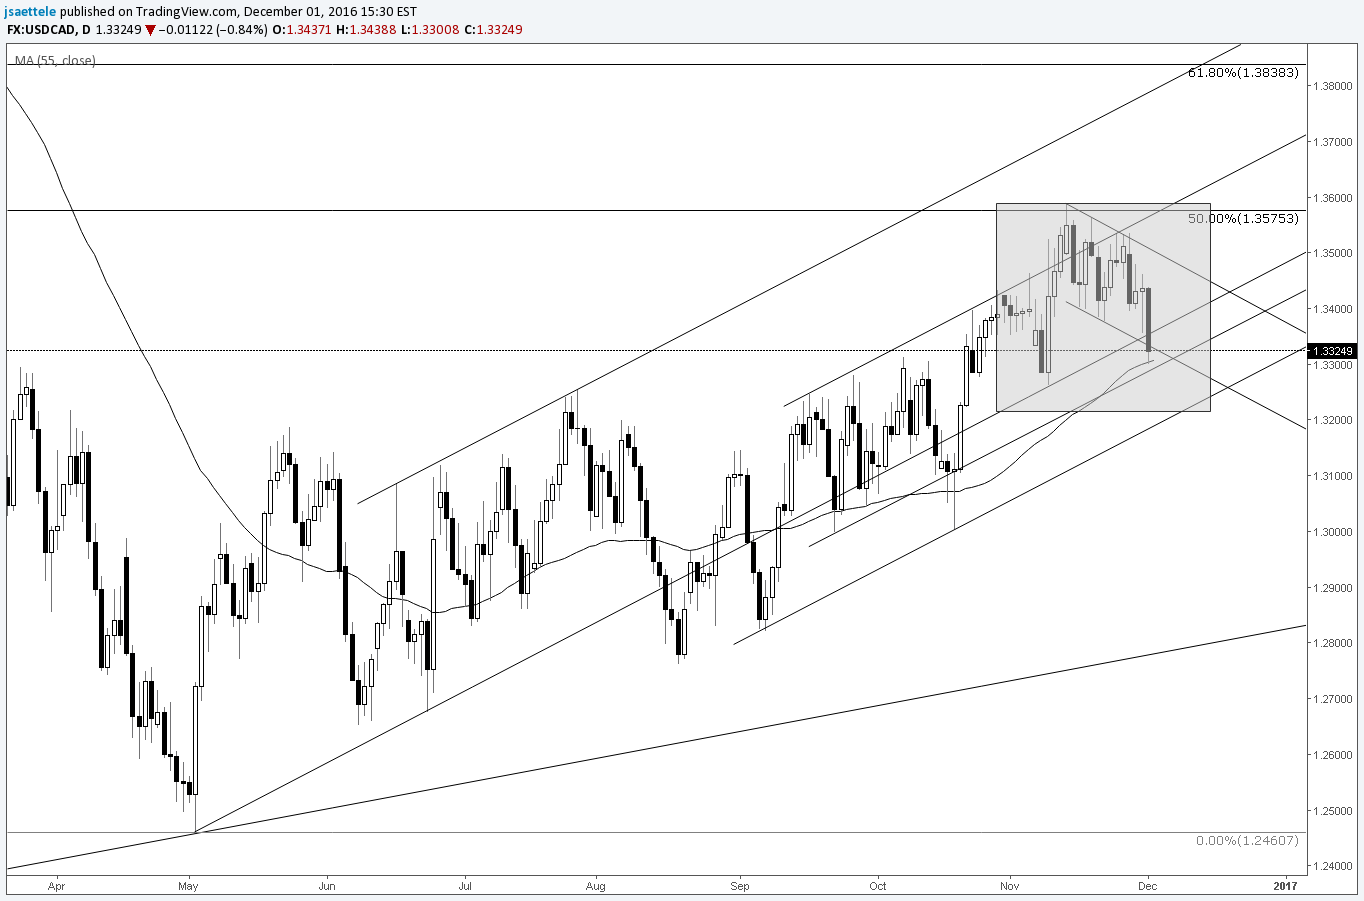
Chart Prepared by Jamie Saettele, CMT

DailyFX Trading Guides and Forecasts

-Today’s USD/CAD drop is threatening the lower bound of a short term channel. A decisive break below this technical barrier would suggest that weakness is impulsive and shift focus to the May-August trendline which is currently just under 1.3100. There is a lot for bears to crack here; the 55 day average pivot highs/lows since March cluster between 1.3260 and 1.3312.


original source

DailyFX provides forex news and technical analysis on the trends that influence the global currency markets.
Learn forex trading with a free practice account and trading charts from IG.