
 Yahoo Finance
 We Like These Underlying Return On Capital Trends At MTQ (SGX:M05)
What trends should we look for it we want to identify stocks that can multiply in value over the long term? Typically, we'll want to notice a trend of growing return on capital employed (ROCE) and alongside that, an expanding base of capital employed. Basically this means that a company has profitable initiatives that it can continue to reinvest in, which is a trait of a compounding machine. So when we looked at MTQ (SGX:M05) and its trend of ROCE, we really liked what we saw.
Return On Capital Employed (ROCE): What Is It?
For those who don't know, ROCE is a measure of a company's yearly pre-tax profit (its return), relative to the capital employed in the business. Analysts use this formula to calculate it for MTQ:
Return on Capital Employed = Earnings Before Interest and Tax (EBIT) ÷ (Total Assets - Current Liabilities)
0.057 = S$5.8m ÷ (S$120m - S$18m) (Based on the trailing twelve months to September 2023).
Thus, MTQ has an ROCE of 5.7%. On its own that's a low return on capital but it's in line with the industry's average returns of 5.7%.
View our latest analysis for MTQ
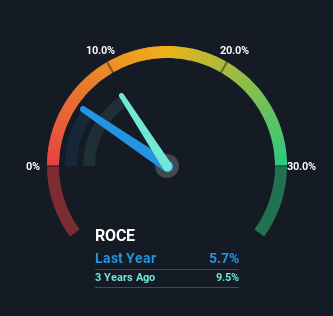
Historical performance is a great place to start when researching a stock so above you can see the gauge for MTQ's ROCE against it's prior returns. If you'd like to look at how MTQ has performed in the past in other metrics, you can view this free graph of MTQ's past earnings, revenue and cash flow.
So How Is MTQ's ROCE Trending?
MTQ has broken into the black (profitability) and we're sure it's a sight for sore eyes. While the business was unprofitable in the past, it's now turned things around and is earning 5.7% on its capital. While returns have increased, the amount of capital employed by MTQ has remained flat over the period. That being said, while an increase in efficiency is no doubt appealing, it'd be helpful to know if the company does have any investment plans going forward. Because in the end, a business can only get so efficient.
The Bottom Line
To sum it up, MTQ is collecting higher returns from the same amount of capital, and that's impressive. Since the stock has returned a solid 84% to shareholders over the last five years, it's fair to say investors are beginning to recognize these changes. Therefore, we think it would be worth your time to check if these trends are going to continue.
On a final note, we've found 4 warning signs for MTQ that we think you should be aware of.
While MTQ may not currently earn the highest returns, we've compiled a list of companies that currently earn more than 25% return on equity. Check out this free list here.
Have feedback on this article? Concerned about the content? Get in touch with us directly. Alternatively, email editorial-team (at) simplywallst.com.
This article by Simply Wall St is general in nature. We provide commentary based on historical data and analyst forecasts only using an unbiased methodology and our articles are not intended to be financial advice. It does not constitute a recommendation to buy or sell any stock, and does not take account of your objectives, or your financial situation. We aim to bring you long-term focused analysis driven by fundamental data. Note that our analysis may not factor in the latest price-sensitive company announcements or qualitative material. Simply Wall St has no position in any stocks mentioned.
