
 Yahoo Finance
 We Like These Underlying Return On Capital Trends At L.S. Starrett (NYSE:SCX)
Finding a business that has the potential to grow substantially is not easy, but it is possible if we look at a few key financial metrics. Typically, we'll want to notice a trend of growing return on capital employed (ROCE) and alongside that, an expanding base of capital employed. This shows us that it's a compounding machine, able to continually reinvest its earnings back into the business and generate higher returns. Speaking of which, we noticed some great changes in L.S. Starrett's (NYSE:SCX) returns on capital, so let's have a look.
Return On Capital Employed (ROCE): What Is It?
For those that aren't sure what ROCE is, it measures the amount of pre-tax profits a company can generate from the capital employed in its business. To calculate this metric for L.S. Starrett, this is the formula:
Return on Capital Employed = Earnings Before Interest and Tax (EBIT) ÷ (Total Assets - Current Liabilities)
0.18 = US$28m ÷ (US$196m - US$42m) (Based on the trailing twelve months to September 2023).
So, L.S. Starrett has an ROCE of 18%. In absolute terms, that's a satisfactory return, but compared to the Machinery industry average of 12% it's much better.
See our latest analysis for L.S. Starrett
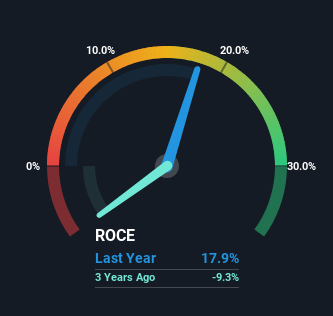
Historical performance is a great place to start when researching a stock so above you can see the gauge for L.S. Starrett's ROCE against it's prior returns. If you'd like to look at how L.S. Starrett has performed in the past in other metrics, you can view this free graph of past earnings, revenue and cash flow.
The Trend Of ROCE
L.S. Starrett has not disappointed with their ROCE growth. More specifically, while the company has kept capital employed relatively flat over the last five years, the ROCE has climbed 446% in that same time. So our take on this is that the business has increased efficiencies to generate these higher returns, all the while not needing to make any additional investments. On that front, things are looking good so it's worth exploring what management has said about growth plans going forward.
In Conclusion...
To bring it all together, L.S. Starrett has done well to increase the returns it's generating from its capital employed. And with the stock having performed exceptionally well over the last five years, these patterns are being accounted for by investors. Therefore, we think it would be worth your time to check if these trends are going to continue.
One more thing, we've spotted 1 warning sign facing L.S. Starrett that you might find interesting.
While L.S. Starrett isn't earning the highest return, check out this free list of companies that are earning high returns on equity with solid balance sheets.
Have feedback on this article? Concerned about the content? Get in touch with us directly. Alternatively, email editorial-team (at) simplywallst.com.
This article by Simply Wall St is general in nature. We provide commentary based on historical data and analyst forecasts only using an unbiased methodology and our articles are not intended to be financial advice. It does not constitute a recommendation to buy or sell any stock, and does not take account of your objectives, or your financial situation. We aim to bring you long-term focused analysis driven by fundamental data. Note that our analysis may not factor in the latest price-sensitive company announcements or qualitative material. Simply Wall St has no position in any stocks mentioned.
