
 Yahoo Finance
 We Like These Underlying Return On Capital Trends At Imperial Oil (TSE:IMO)
If you're not sure where to start when looking for the next multi-bagger, there are a few key trends you should keep an eye out for. Ideally, a business will show two trends; firstly a growing return on capital employed (ROCE) and secondly, an increasing amount of capital employed. Ultimately, this demonstrates that it's a business that is reinvesting profits at increasing rates of return. With that in mind, we've noticed some promising trends at Imperial Oil (TSE:IMO) so let's look a bit deeper.
Return On Capital Employed (ROCE): What Is It?
If you haven't worked with ROCE before, it measures the 'return' (pre-tax profit) a company generates from capital employed in its business. Analysts use this formula to calculate it for Imperial Oil:
Return on Capital Employed = Earnings Before Interest and Tax (EBIT) ÷ (Total Assets - Current Liabilities)
0.18 = CA$6.2b ÷ (CA$41b - CA$6.6b) (Based on the trailing twelve months to December 2023).
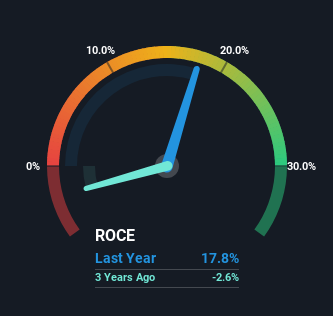
So, Imperial Oil has an ROCE of 18%. In absolute terms, that's a satisfactory return, but compared to the Oil and Gas industry average of 9.0% it's much better.
View our latest analysis for Imperial Oil
In the above chart we have measured Imperial Oil's prior ROCE against its prior performance, but the future is arguably more important. If you'd like, you can check out the forecasts from the analysts covering Imperial Oil for free.
How Are Returns Trending?
Imperial Oil has not disappointed with their ROCE growth. More specifically, while the company has kept capital employed relatively flat over the last five years, the ROCE has climbed 116% in that same time. So our take on this is that the business has increased efficiencies to generate these higher returns, all the while not needing to make any additional investments. The company is doing well in that sense, and it's worth investigating what the management team has planned for long term growth prospects.
The Key Takeaway
To bring it all together, Imperial Oil has done well to increase the returns it's generating from its capital employed. And with the stock having performed exceptionally well over the last five years, these patterns are being accounted for by investors. With that being said, we still think the promising fundamentals mean the company deserves some further due diligence.
One more thing, we've spotted 1 warning sign facing Imperial Oil that you might find interesting.
While Imperial Oil isn't earning the highest return, check out this free list of companies that are earning high returns on equity with solid balance sheets.
Have feedback on this article? Concerned about the content? Get in touch with us directly. Alternatively, email editorial-team (at) simplywallst.com.
This article by Simply Wall St is general in nature. We provide commentary based on historical data and analyst forecasts only using an unbiased methodology and our articles are not intended to be financial advice. It does not constitute a recommendation to buy or sell any stock, and does not take account of your objectives, or your financial situation. We aim to bring you long-term focused analysis driven by fundamental data. Note that our analysis may not factor in the latest price-sensitive company announcements or qualitative material. Simply Wall St has no position in any stocks mentioned.
