
 Yahoo Finance
 We Like These Underlying Return On Capital Trends At Hertz Global Holdings (NASDAQ:HTZ)
Did you know there are some financial metrics that can provide clues of a potential multi-bagger? In a perfect world, we'd like to see a company investing more capital into its business and ideally the returns earned from that capital are also increasing. Put simply, these types of businesses are compounding machines, meaning they are continually reinvesting their earnings at ever-higher rates of return. So on that note, Hertz Global Holdings (NASDAQ:HTZ) looks quite promising in regards to its trends of return on capital.
Return On Capital Employed (ROCE): What Is It?
Just to clarify if you're unsure, ROCE is a metric for evaluating how much pre-tax income (in percentage terms) a company earns on the capital invested in its business. The formula for this calculation on Hertz Global Holdings is:
Return on Capital Employed = Earnings Before Interest and Tax (EBIT) ÷ (Total Assets - Current Liabilities)
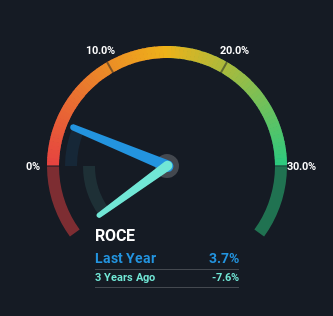
0.037 = US$756m ÷ (US$25b - US$4.4b) (Based on the trailing twelve months to December 2023).
So, Hertz Global Holdings has an ROCE of 3.7%. In absolute terms, that's a low return and it also under-performs the Transportation industry average of 7.4%.
See our latest analysis for Hertz Global Holdings
Above you can see how the current ROCE for Hertz Global Holdings compares to its prior returns on capital, but there's only so much you can tell from the past. If you're interested, you can view the analysts predictions in our free analyst report for Hertz Global Holdings .
What Does the ROCE Trend For Hertz Global Holdings Tell Us?
While the ROCE isn't as high as some other companies out there, it's great to see it's on the up. Looking at the data, we can see that even though capital employed in the business has remained relatively flat, the ROCE generated has risen by 50% over the last five years. Basically the business is generating higher returns from the same amount of capital and that is proof that there are improvements in the company's efficiencies. The company is doing well in that sense, and it's worth investigating what the management team has planned for long term growth prospects.
What We Can Learn From Hertz Global Holdings' ROCE
As discussed above, Hertz Global Holdings appears to be getting more proficient at generating returns since capital employed has remained flat but earnings (before interest and tax) are up. And since the stock has fallen 61% over the last year, there might be an opportunity here. That being the case, research into the company's current valuation metrics and future prospects seems fitting.
One final note, you should learn about the 4 warning signs we've spotted with Hertz Global Holdings (including 2 which are concerning) .
While Hertz Global Holdings may not currently earn the highest returns, we've compiled a list of companies that currently earn more than 25% return on equity. Check out this free list here.
Have feedback on this article? Concerned about the content? Get in touch with us directly. Alternatively, email editorial-team (at) simplywallst.com.
This article by Simply Wall St is general in nature. We provide commentary based on historical data and analyst forecasts only using an unbiased methodology and our articles are not intended to be financial advice. It does not constitute a recommendation to buy or sell any stock, and does not take account of your objectives, or your financial situation. We aim to bring you long-term focused analysis driven by fundamental data. Note that our analysis may not factor in the latest price-sensitive company announcements or qualitative material. Simply Wall St has no position in any stocks mentioned.
