
 Yahoo Finance
 We Like These Underlying Return On Capital Trends At Computershare (ASX:CPU)
What trends should we look for it we want to identify stocks that can multiply in value over the long term? Ideally, a business will show two trends; firstly a growing return on capital employed (ROCE) and secondly, an increasing amount of capital employed. Basically this means that a company has profitable initiatives that it can continue to reinvest in, which is a trait of a compounding machine. So on that note, Computershare (ASX:CPU) looks quite promising in regards to its trends of return on capital.
Return On Capital Employed (ROCE): What Is It?
If you haven't worked with ROCE before, it measures the 'return' (pre-tax profit) a company generates from capital employed in its business. To calculate this metric for Computershare, this is the formula:
Return on Capital Employed = Earnings Before Interest and Tax (EBIT) ÷ (Total Assets - Current Liabilities)
0.16 = US$771m ÷ (US$6.2b - US$1.3b) (Based on the trailing twelve months to December 2023).
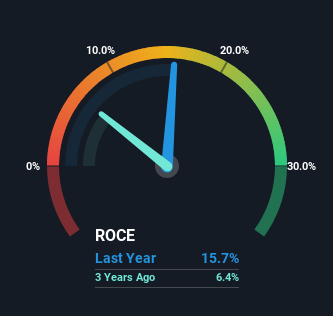
Therefore, Computershare has an ROCE of 16%. In absolute terms, that's a pretty normal return, and it's somewhat close to the Professional Services industry average of 15%.
Check out our latest analysis for Computershare
In the above chart we have measured Computershare's prior ROCE against its prior performance, but the future is arguably more important. If you're interested, you can view the analysts predictions in our free analyst report for Computershare .
What The Trend Of ROCE Can Tell Us
Computershare is displaying some positive trends. The numbers show that in the last five years, the returns generated on capital employed have grown considerably to 16%. Basically the business is earning more per dollar of capital invested and in addition to that, 30% more capital is being employed now too. The increasing returns on a growing amount of capital is common amongst multi-baggers and that's why we're impressed.
The Bottom Line
All in all, it's terrific to see that Computershare is reaping the rewards from prior investments and is growing its capital base. Since the stock has returned a solid 84% to shareholders over the last five years, it's fair to say investors are beginning to recognize these changes. So given the stock has proven it has promising trends, it's worth researching the company further to see if these trends are likely to persist.
One more thing, we've spotted 2 warning signs facing Computershare that you might find interesting.
If you want to search for solid companies with great earnings, check out this free list of companies with good balance sheets and impressive returns on equity.
Have feedback on this article? Concerned about the content? Get in touch with us directly. Alternatively, email editorial-team (at) simplywallst.com.
This article by Simply Wall St is general in nature. We provide commentary based on historical data and analyst forecasts only using an unbiased methodology and our articles are not intended to be financial advice. It does not constitute a recommendation to buy or sell any stock, and does not take account of your objectives, or your financial situation. We aim to bring you long-term focused analysis driven by fundamental data. Note that our analysis may not factor in the latest price-sensitive company announcements or qualitative material. Simply Wall St has no position in any stocks mentioned.
Have feedback on this article? Concerned about the content? Get in touch with us directly. Alternatively, email editorial-team@simplywallst.com
